Thursday, September 30, 2021

GDP ... Jobless Claims ... Chicago PMI … Coronavirus (Covid-19) … Stock Market Analysis … ETF Trading … Dow 30 Ranking


“What I have made clear to the President and Democratic leaders is that spending trillions more on new and expanded government programs, when we can’t even pay for the essential social programs, like Social Security and Medicare, is the definition of fiscal insanity.” - Senator Joe Manchin (D-WV), Open Letter, 29 September 2021. 


GDP (The Columbian)

“The U.S. economy expanded at a 6.7% annual pace from April through June, the Commerce Department said Thursday, slightly upgrading its estimate of last quarter’s growth in the face of a resurgence of COVID-19 in the form of the delta variant.” Story at...

https://www.columbian.com/news/2021/sep/30/u-s-slightly-revises-up-its-gdp-estimate-for-q2-to-6-7/


JOBLESS CLAIMS (Yahoo Finance)

“U.S. states saw an unexpected increase in initial jobless filings last week, even as companies across industries looked to bring on workers to fill widespread vacancies...Initial unemployment claims, week ended September 25: 362,000 vs. 330,000 expected...”  Story at...

https://finance.yahoo.com/news/weekly-jobless-claims-week-ended-september-25-2021-180212425.html


CHICAGO PMI (Advisor Perspectives)

“The latest Chicago Purchasing Manager's Index, or the Chicago Business Barometer, fell to 64.7 in September - it's lowest since February, from 66.8 in August...Values above 50.0 indicate expanding manufacturing activity.” Commentary and charts at...

https://www.advisorperspectives.com/dshort/updates/2021/09/30/september-chicago-pmi-lowest-since-february?topic=covid-19-coronavirus-coverage


CORONAVIRUS (NTSM)

Here’s the latest from the COVID19 Johns Hopkins website as of 4:30 PM Thursday. U.S. total case numbers are on the left axis; daily numbers are on the right side of the graph in Red with the 10-dMA of daily numbers in Green.


I added the smoothed 10-dMA of new cases (in purple) to the chart.


MARKET REPORT / ANALYSIS

-Thursday the S&P 500 fell about 1.2% to 4308.

-VIX rose about 3% to 23.14.

-The yield on the 10-year Treasury dropped to 1.487%.


Not too many bull signs out there.  I expect the markets will continue to have trouble.


Utilities (the XLU-ETF) were down, but still outperformed the S&P 500 today, so defensive seems to be a good idea.


The daily sum of 20 Indicators remained -10 (a positive number is bullish; negatives are bearish); the 10-day smoothed sum that smooths the daily fluctuations declined from -55 to -57 (These numbers sometimes change after I post the blog based on data that comes in late.) Most of these indicators are short-term and many are trend following.


The Long Term NTSM indicator ensemble remained SELL. VIX and Volume were bearish; Price & Sentiment indicators are neutral.


Needless to say, I’m bearish.


I’m busy Friday, so the Blog will be posted later than usual, Friday or Saturday.


MOMENTUM ANALYSIS:

TODAY’S RANKING OF 15 ETFs (Ranked Daily)

The top ranked ETF receives 100%. The rest are then ranked based on their momentum relative to the leading

ETF.

*For additional background on the ETF ranking system see NTSM Page at…

http://navigatethestockmarket.blogspot.com/p/exchange-traded-funds-etf-ranking.html


TODAY’S RANKING OF THE DOW 30 STOCKS (Ranked Daily)

Here’s the revised DOW 30 and its momentum analysis. The top ranked stock receives 100%. The rest are then ranked based on their momentum relative to the leading stock.

For more details, see NTSM Page at…

https://navigatethestockmarket.blogspot.com/p/a-system-for-trading-dow-30-stocks-my_8.html


THURSDAY MARKET INTERNALS (NYSE DATA)

Market Internals remained BEARISH on the market.


Market Internals are a decent trend-following analysis of current market action, but should not be used alone for short term trading. They are usually right, but they are often late.  They are most useful when they diverge from the Index. 


My stock-allocation in the portfolio is now about 45% invested in stocks; this is below my “normal” fully invested allocation of 50%.


You may wish to have a higher or lower % invested in stocks depending on your risk tolerance. 50% is a conservative position that I consider fully invested for most retirees.


As a general rule, some suggest that the % of portfolio invested in the stock market should be one’s age subtracted from 100.  So, a 30-year-old person would have 70% of the portfolio in stocks, stock mutual funds and/or stock ETFs.  That’s ok, but for older investors, I usually don’t recommend keeping less than 50% invested in stocks (as a fully invested position) since most people need some growth in the portfolio to keep up with inflation.

Wednesday, September 29, 2021

Pending Home Sales ... EIA Crude Inventories ... Unsettled? … Coronavirus (Covid-19) … Stock Market Analysis … ETF Trading … Dow 30 Ranking


PENDING HOME SALES (YahooFinance)

“Pending home sales, a leading indicator of the health of the housing market, rose in August, reversing two straight months of declines. The National Association of Realtors’ (NAR) Pending Home Sales Index, which tracks the number of homes that are under contract to be sold, rose 8.1% in August to a seven-month high from the previous month.” Story at...

https://finance.yahoo.com/news/pending-home-sales-august-2021-140006767.html


EIA CRUDE INVENTORIES (EIA)

“U.S. commercial crude oil inventories (excluding those in the Strategic Petroleum Reserve) increased by 4.6 million barrels from the previous week. At 418.5 million barrels, U.S. crude oil inventories are about 7% below the five year average for this time of year.”  Press release at...

https://ir.eia.gov/wpsr/wpsrsummary.pdf


BOOK REVIEW: “UNSETTLED: WHAT CLIMATE SCIENCE TELLS US ABOUT GLOBAL WARMING AND WHAT IT DOESN’T, BY STEVEN E. KOONIN”  (RealClearEnergy)

“Koonin’s indictment of The Science starts with its reliance on unreliable computer models...One particularly jarring feature is that the simulated average global surface temperature,” Koonin notes, “varies among models by about 3°C, three times greater than the observed value of the twentieth century warming they’re purporting to describe and explain.” Another embarrassing feature of climate models concerns the earlier of the two twentieth-century warmings from 1910 to 1940, when human influences were much smaller. On average, models give a warming rate of about half of what was actually observed...“That the models can’t reproduce the past is a big red flag – it erodes confidence in their projections of future climates.” Neither is it reassuring that for the years after 1960, the latest generation of climate models show a larger spread and greater uncertainty than earlier ones – implying that, far from advancing, The Science has been going backwards. That is not how science is meant to work.” Book Review at...

https://www.realclearenergy.org/articles/2021/05/20/unsettled_what_climate_science_tells_us_what_it_doesnt_and_why_it_matters_by_steven_e_koonin_778065.html?mc_cid=d03c344e9b&mc_eid=891d8cfdc0

My cmt: I am reading “Unsettled?” now.  It is a very good book.  Dr. Koonin is not a climate denier.  He goes into great detail explaining the earth’s temperature rise of 1.1 degree C over the last 120 years. He discusses CO2 as the primary greenhouse gas and its increase over the 20th Century. However, the book is disturbing, because he presents a convincing case that a great deal of the science related to the impacts of Global Warming is truly unsettled and subject to media propaganda.


LET’S WORK FOR SCIENCE WITH INTEGRITY (Forbes)

...Why is the [climate] science so poorly communicated to the public and policy makers? For Koonin, it is clear that distorted science serves the interests of diverse players, ranging from environmental NGOs [Non-Governmental Orgaizations], media, politicians, scientists and scientific organizations. The ideological corruption of the hard sciences has been remarked upon by others but Koonin covers it with telling examples arising from his own experiences over the years. Climate science, he asserts, has been an effort “to persuade rather than inform”, leaving out what does not fit the overarching narrative.... “It is up to scientists to put forward facts without an agenda or a pre-existing narrative, but it is not easy. Koonin says, “I should know, that used to be my job” Story at...

https://www.forbes.com/sites/tilakdoshi/2021/04/30/lets-work-for-science-with-integrity-steve-koonins-new-book-unsettled/?sh=91c46a72f383


CORONAVIRUS (NTSM)

Here’s the latest from the COVID19 Johns Hopkins website as of 9:00 PM Wednesday. U.S. total case numbers are on the left axis; daily numbers are on the right side of the graph in Red with the 10-dMA of daily numbers in Green.


I added the smoothed 10-dMA of new cases (in purple) to the chart.


MARKET REPORT / ANALYSIS

-Wednesday the S&P 500 rose about 0.2% to 4359.

-VIX slipped about 3% to 22.56.

-The yield on the 10-year Treasury rose to 1.512%.


The Democrats have the votes to raise the Debt Limit without any action from the Republicans and the Republicans won’t vote to raise the Debt Ceiling. That’s what the Republicans have been saying all along. So, we have a crisis, because the democrats won’t pass the Debt Ceiling and they (the Democrats) are trying to blame the Republicans. Insane. Both parties are just posturing and neither deserves our respect, or votes for that matter.


The current market weakness could always just be a result of the clowns in DC. Sorry, I didn't mean to insult clowns.


The S&P 500 tested the prior low yesterday, but volume was higher and internals were worse – that’s a “failed test” that suggests that selling pressure increased.  Is more selling to come? It would seem so, but there is no guarantee and these signals can sometimes be just a fake-out. In this case, my long-term ensemble indicator also switched to sell.  Together, or separately, they are decent enough signals that I cut stock holdings to 45%. Is it the right decision? I don’t really know, but I am following the indicators rather than over thinking the decision. Trade what you see not what you think.


The daily sum of 20 Indicators declined from -3 to -10 (a positive number is bullish; negatives are bearish); the 10-day smoothed sum that smooths the daily fluctuations declined from -53 to -55 (These numbers sometimes change after I post the blog based on data that comes in late.) Most of these indicators are short-term and many are trend following.


The Long Term NTSM indicator ensemble dropped to SELL. VIX and Volume were bearish; Price & Sentiment indicators are neutral.


I’m leaning bearish, but who knows – perhaps buy-and-hold would have worked better. We’ll have to wait and see.


Utilities (the XLU-ETF) way outperformed the S&P 500 today, so there are others who agree that a more defensive stance might be a good idea.


MOMENTUM ANALYSIS:

TODAY’S RANKING OF 15 ETFs (Ranked Daily)

The top ranked ETF receives 100%. The rest are then ranked based on their momentum relative to the leading

ETF.


*For additional background on the ETF ranking system see NTSM Page at…

http://navigatethestockmarket.blogspot.com/p/exchange-traded-funds-etf-ranking.html


TODAY’S RANKING OF THE DOW 30 STOCKS (Ranked Daily)

Here’s the revised DOW 30 and its momentum analysis. The top ranked stock receives 100%. The rest are then ranked based on their momentum relative to the leading stock.

For more details, see NTSM Page at…

https://navigatethestockmarket.blogspot.com/p/a-system-for-trading-dow-30-stocks-my_8.html


WEDNESDAY MARKET INTERNALS (NYSE DATA)

Market Internals declined to BEARISH on the market.


Market Internals are a decent trend-following analysis of current market action, but should not be used alone for short term trading. They are usually right, but they are often late.  They are most useful when they diverge from the Index. 


My stock-allocation in the portfolio is now about 45% invested in stocks; this is below my “normal” fully invested allocation of 50%.


You may wish to have a higher or lower % invested in stocks depending on your risk tolerance. 50% is a conservative position that I consider fully invested for most retirees.


As a general rule, some suggest that the % of portfolio invested in the stock market should be one’s age subtracted from 100.  So, a 30-year-old person would have 70% of the portfolio in stocks, stock mutual funds and/or stock ETFs.  That’s ok, but for older investors, I usually don’t recommend keeping less than 50% invested in stocks (as a fully invested position) since most people need some growth in the portfolio to keep up with inflation.

Selling Some Stocks

Given that Monday was a failed test of the prior low, I decided to cut back on stock holdings today.  Basically,  I took losses in MSFT and IBB to get to 45% invested in stocks.


As of mid-day, my long term ensemble is a sell. That’s another reason to take a more conservative view of the markets.

Tuesday, September 28, 2021

Consumer Confidence ... Inflation Lasting Longer ... Morgan Stanley Remains Bearish ... Hurricanes are Getting Stronger? … Coronavirus (Covid-19) … Stock Market Analysis … ETF Trading … Dow 30 Ranking

CONSUMER CONFIDENCE (Advisor Perspectives)

“Consumer confidence dropped in September as the spread of the Delta variant continued to dampen optimism,” said Lynn Franco, Senior Director of Economic Indicators at The Conference Board. “Concerns about the state of the economy and short-term growth prospects deepened, while spending intentions for homes, autos, and major appliances all retreated again. Short-term inflation concerns eased somewhat, but remain elevated. Consumer confidence is still high by historical levels—enough to support further growth in the near-term—but the Index has now fallen 19.6 points from the recent peak of 128.9 reached in June. These back-to-back declines suggest consumers have grown more cautious and are likely to curtail spending going forward.” Commentary at...

https://www.advisorperspectives.com/dshort/updates/2021/09/28/consumer-confidence-down-again-in-september


POWELL SAYS SPIKE IN INFLATION LASTING LONGER THAN EXPECTED (AP via msn.com)

“Federal Reserve Chairman Jerome Powell is preparing to tell Congress that the current spike in U.S. inflation has proven to be larger and more long-lasting than expected. But, in remarks prepared for delivery Tuesday, he says that if inflation does not abate, the Fed is ready to use its tools to lower the pressure on prices.” Story at...

Powell says spike in inflation lasting longer than expected (msn.com)


MORGAN STANLEY REMAINS BEARISH (moguldom)

“Some deteriorating market indicators and the end of major pandemic relief programs suggest a coming plunge of more than 20 percent in U.S. stocks as the economy returns to a more normalized pace. The transition could be rougher than many expect, according to Morgan Stanley, which is considered more bearish than most Wall Street strategists. In a note to clients, chief US. Morgan Stanley Equity Strategist Mike Wilson said that the market is at a fork in the road with one road leading to “fire” and the other to “ice.” The market appears to be heading down the ice path.”  Story at

https://moguldom.com/373178/morgan-stanley-expect-stocks-to-fall-20-percent-in-destructive-outcome-for-bull-market/


HOW CLIMATE CHANGE MAKES HURRICANES MORE DESTRUCTIVE (Environmental Defense Fund)

“Researchers suggest that the most damaging U.S. hurricanes are three times more frequent than 100 years ago, and that the proportion of major hurricanes (Category 3 or above) in the Atlantic Ocean has doubled since 1980. How fast hurricanes intensify has also increased in the Atlantic since the 1980s, due to climate change.”  Story at... 

https://www.edf.org/climate/how-climate-change-makes-hurricanes-more-destructive?utm_source=google&utm_campaign=edf_none_upd_dmt&utm_medium=cpc&utm_id=1606920135&gclid=CjwKCAjw7rWKBhAtEiwAJ3CWLHTHfxR5S3bp5OuwnYPFlLcSCJP31phOb9939kbagCvFY1nRmCJMGBoC8VUQAvD_BwE&gclsrc=aw.ds

Well, not really...

“In terms of frequency, studies have consistently shown “no discernible trend in the global number of tropical cyclones.” – Yale Climate Connections.

Regarding intensity...


THE NATIONAL CLIMATE ASSESSMENT SAYS HURRICANE INTENSITY HASN’T EXCEEDED NORMAL VARIABILITY (NCA, CSSR)

The National Climate Assessment issued in 2017 as the Climate Science Special Report states “...the globally observed changes...would not necessarily support a detectable trend in tropical storm intensity...the trend signal has not yet had time to rise above the background variability of natural processes.” - CSSR


“If we can’t have confidence that a durable trend exists, we certainly can’t confidently attribute one to human influences...Given the large variations in data, one could plausibly [examine the trend] from 1960 to 1985 with a comparative negative trend [in intensity].” – Steven Koonin, Phd. From his book, “Unsettled? What Climate Science Tells us and What it Doesn’t and Why it Matters.”


My cmt: Global Warming is real: the earth has warmed 1 degree C in the last 100 years. It is sad that there is now a media consensus and propaganda program to convince the public that Global Warming will have catastrophic effects when the science isn’t settled.


Jeremy Grantham was on CNBC this afternoon warning of Armageddon if global-warming goes up another 2 degrees C (3 degrees C total). I point out again (I posted this a few days ago): The UN’s Intergovernmental Panel on Climate Change and the US government’s National Climate Assessments — indicate that “significant human-induced climate change would have negligible net economic impact on either the world or the US economies by the end of this century”... Story at...

https://www.forbes.com/sites/tilakdoshi/2021/04/30/lets-work-for-science-with-integrity-steve-koonins-new-book-unsettled/?sh=91c46a72f383

That report assumes a 3 degree C warming by the end of the century. None of this means we should do nothing, but to destroy the economy to get to zero carbon may not be realistic, or necessary, especially given that the rest of the world is not going to get to zero carbon and emerging markets, including China and India, aren’t even trying.


CORONAVIRUS (NTSM)

Here’s the latest from the COVID19 Johns Hopkins website as of 5:30 PM Tuesday. U.S. total case numbers are on the left axis; daily numbers are on the right side of the graph in Red with the 10-dMA of daily numbers in Green.


I added the smoothed 10-dMA of new cases (in purple) to the chart. Finally, there is a clear trend down.


MARKET REPORT / ANALYSIS

-Tuesday the S&P 500 fell about 2% to 4353.

-VIX rose about 23% to 23.11.

-The yield on the 10-year Treasury rose to 1.541%.


Ruh-Roh!! The S&P 500 fell below its recent low of 4354 a week ago (21 September) and it did it with deterioration in the basic internals.  Breadth, volume and new-lows were all worse today than last week.  That’s not good. It suggests a continuation of the pullback even though the previous numbers and market action seemed to show an end.  This was a Distribution Day suggesting the Pros are selling.


There was also a Hindenburg Omen today.  This signal is usually a concern when there are several clustered together. There were five about 2 weeks before the 2 September top.


The Hindenburg Omen is a stock market indicator named after the famous crash of the Hindenburg dirigible in New Jersey in 1937. As you might expect, it is supposed to forewarn of a stock market crash.  To have a Hindenburg Omen warning the following conditions must be met:

“-The daily number of new 52-week highs and 52-week lows in a stock market index are greater than a threshold amount (typically 2.2%).

-The 52-week highs cannot be more than two times the 52-week lows.

-The stock market index is still in an uptrend. A 10-week moving average, or the 50-day rate of change indicator, is used to indicate this.

-The McClellan Oscillator (MCO), a measure of the shift in market sentiment, is negative.”

Definition from Investopedia at...

https://www.investopedia.com/terms/h/hindenburgomen.asp


On the good side, today was a statistically significant down-day. That just means that the price-volume move exceeded my statistical parameters. Statistics show that a statistically-significant, down-day is followed by an up-day about 60% of the time. 


The S&P 500 is sitting just above its 100-dMA. It sure looks like the Index wants to test its 200-dMA. A break below the 100-dMA will not be a good sign.


The daily sum of 20 Indicators declined from +3 to -3 (a positive number is bullish; negatives are bearish); the 10-day smoothed sum that smooths the daily fluctuations improved from -60 to -53 (These numbers sometimes change after I post the blog based on data that comes in late.) Most of these indicators are short-term and many are trend following.


The Long Term NTSM indicator ensemble remained HOLD. Volume was bearish; VIX, Price & Sentiment indicators are neutral.


VIX is very close to a sell.  If I get a Long-term indicator sell-signal, I will sell my recent acquisitions.  BTW, I bought the high momentum stocks/ETFs in my momentum system – none of them have held up over the last several days of trading.


I’m suddenly leaning bearish and I’ll probably be a bear tomorrow if this weakness continues. That will require taking some losses in recent purchases – discipline.


MOMENTUM ANALYSIS:

TODAY’S RANKING OF 15 ETFs (Ranked Daily)

The top ranked ETF receives 100%. The rest are then ranked based on their momentum relative to the leading

ETF.


*For additional background on the ETF ranking system see NTSM Page at…

http://navigatethestockmarket.blogspot.com/p/exchange-traded-funds-etf-ranking.html


TODAY’S RANKING OF THE DOW 30 STOCKS (Ranked Daily)

Here’s the revised DOW 30 and its momentum analysis. The top ranked stock receives 100%. The rest are then ranked based on their momentum relative to the leading stock.


For more details, see NTSM Page at…

https://navigatethestockmarket.blogspot.com/p/a-system-for-trading-dow-30-stocks-my_8.html


TUESDAY MARKET INTERNALS (NYSE DATA)

Market Internals remained NEUTRAL on the market.


Market Internals are a decent trend-following analysis of current market action, but should not be used alone for short term trading. They are usually right, but they are often late.  They are most useful when they diverge from the Index. 


My stock-allocation in the portfolio is now about 55% invested in stocks; this is slightly above my “normal” fully invested allocation of 50%.


You may wish to have a higher or lower % invested in stocks depending on your risk tolerance. 50% is a conservative position that I consider fully invested for most retirees.


As a general rule, some suggest that the % of portfolio invested in the stock market should be one’s age subtracted from 100.  So, a 30-year-old person would have 70% of the portfolio in stocks, stock mutual funds and/or stock ETFs.  That’s ok, but for older investors, I usually don’t recommend keeping less than 50% invested in stocks (as a fully invested position) since most people need some growth in the portfolio to keep up with inflation.

Monday, September 27, 2021

Durable Orders … The S&P 500 Needs to Hold this Level ... Coronavirus (Covid-19) … Stock Market Analysis … ETF Trading … Dow 30 Ranking


DURABLE ORDERS (Fox Business)

“Orders for big-ticket items jumped last month as manufacturers continued to navigate the supply-chain disruptions caused by COVID-19. New orders for manufactured durable goods in August rose 1.8% to $263.5 billion, according to the Census Bureau.” Story at... 

https://www.foxbusiness.com/economy/durable-goods-orders-august-2021


THE S&P 500 HAS TO HOLD THIS LEVEL (MarketWatch)

“This [the S&P 500 break above its 50-dMA]  is obviously a bullish development, but we want to make sure that it holds above that 50-DMA into next week. If it does, it will be quite bullish,” wrote Maley [Matt Maley, chief market strategist at Miller Tabak + Co.]...Should that happen, Maley said he’ll be “back to watching the 100-DMA like a hawk. Any meaningful break below that 100-DMA and its lows from Monday would scare the hell out of people. Therefore, that kind of move over the next few weeks would be very bearish,” he said.” Story at...

https://www.marketwatch.com/story/the-s-p-500-has-to-hold-this-line-in-the-sand-or-risk-a-terrifying-plunge-says-strategist-11632482192?siteid=yhoof2


UN IPCC REPORT CODE RED FOR CLIMATE ALARMISM (Washington Examiner)

“This summer, the United Nations's Intergovernmental Panel on Climate Change released the near-final version of its “Sixth Assessment Report,” an apparently comprehensive survey of the climate literature since the last one in 2014....Reading the report gives the impression the weather is getting much, much worse. What it doesn’t say is that people are getting much, much better at adapting to “extreme” weather events.

...The lurid new IPCC report is a code red for alarmism. Humanity seems to be doing just fine. And we will be around to run an experiment in adaptation, which so far is looking successful.” Story at...

The UN's IPCC report is a code red for climate alarmism (msn.com)


CORONAVIRUS (NTSM)

Here’s the latest from the COVID19 Johns Hopkins website as of 4:30 PM Monday. U.S. total case numbers are on the left axis; daily numbers are on the right side of the graph in Red with the 10-dMA of daily numbers in Green.


I added the smoothed 10-dMA of new cases (in purple) to the chart.


MARKET REPORT / ANALYSIS

-Monday the S&P 500 slipped about 0.3% to 4443.

-VIX rose about 6% to 18.85.

-The yield on the 10-year Treasury rose to 1.485%.


The Friday run-down of some important indicators turned bullish (7-bear and 10

-bull). Bull signs continue. Today’s internals were all bullish and the 50-dMA of issues advancing on the NYSE finished above 50%, another bullish sign.


The daily sum of 20 Indicators improved from -1 to +3 (a positive number is bullish; negatives are bearish); the 10-day smoothed sum that smooths the daily fluctuations improved from -73 to -60 (These numbers sometimes change after I post the blog based on data that comes in late.) Most of these indicators are short-term and many are trend following.


The Long Term NTSM indicator ensemble remained HOLD. Volume, VIX, Price & Sentiment indicators are neutral.


I’m bullish.


MOMENTUM ANALYSIS:

TODAY’S RANKING OF 15 ETFs (Ranked Daily)

The top ranked ETF receives 100%. The rest are then ranked based on their momentum relative to the leading

ETF.

*For additional background on the ETF ranking system see NTSM Page at…

http://navigatethestockmarket.blogspot.com/p/exchange-traded-funds-etf-ranking.html

TODAY’S RANKING OF THE DOW 30 STOCKS (Ranked Daily)

Here’s the revised DOW 30 and its momentum analysis. The top ranked stock receives 100%. The rest are then ranked based on their momentum relative to the leading stock.


For more details, see NTSM Page at…

https://navigatethestockmarket.blogspot.com/p/a-system-for-trading-dow-30-stocks-my_8.html

MONDAY MARKET INTERNALS (NYSE DATA)

Market Internals remained NEUTRAL on the market.


Market Internals are a decent trend-following analysis of current market action, but should not be used alone for short term trading. They are usually right, but they are often late.  They are most useful when they diverge from the Index. 


My stock-allocation in the portfolio is now about 55% invested in stocks; this is slightly above my “normal” fully invested allocation of 50%.


You may wish to have a higher or lower % invested in stocks depending on your risk tolerance. 50% is a conservative position that I consider fully invested for most retirees.


As a general rule, some suggest that the % of portfolio invested in the stock market should be one’s age subtracted from 100.  So, a 30-year-old person would have 70% of the portfolio in stocks, stock mutual funds and/or stock ETFs.  That’s ok, but for older investors, I usually don’t recommend keeping less than 50% invested in stocks (as a fully invested position) since most people need some growth in the portfolio to keep up with inflation.

Saturday, September 25, 2021

Trump Loses Arizona - Again

“Arizona’s official results say President Biden won by 10,457 votes. Mr. Trump never accepted the loss, so the GOP state Senate launched an “audit” by hiring Cyber Ninjas...[their]...hand recount of Maricopa County’s 2.1 million ballots says that Mr. Biden won the state by 10,817 votes....

...On Friday Mr. Trump was set to Defcon 1, saying the audit found “incomprehensible Fraud at an Election Changing level,” and demanding that Arizona “immediately decertify their 2020 Presidential Election Results.” Is anyone surprised? This is what Mr. Trump does, regardless of the facts.”  Story at...

https://www.wsj.com/articles/donald-trump-loses-arizona-again-maricopa-county-recount-2020-election-11632604370

My cmt: The above story is from the Wall Street Journal a right leaning newspaper that supported Trump during his presidency. I supported Trump’s Presidency, too, but as I have said ever since the election, “Never again!”  The man is a certified loony. He is too unbalanced to be trusted with any position in Government.


Friday, September 24, 2021

Border Patrol BS ... Global Warming … New Home Sales ... Oil Breakout? ... Cargo Ships Stuck in LA and Long Beach ... Coronavirus (Covid-19) … Stock Market Analysis … ETF Trading … Dow 30 Ranking

(GLOBAL WARMING) LET’S WORK FOR SCIENCE WITH INTEGRITY (Forbes)

“Contrary to popular belief, even the official assessment reports – such as those by the UN’s Intergovernmental Panel on Climate Change and the US government’s National Climate Assessments — indicate that “significant human-induced climate change would have negligible net economic impact on either the world or the US economies by the end of this century”... Story at...

https://www.forbes.com/sites/tilakdoshi/2021/04/30/lets-work-for-science-with-integrity-steve-koonins-new-book-unsettled/?sh=91c46a72f383

My cmt: Who would guess that conclusion based on the constant barrage of global warming scare tactics by the media?


NEW HOME SALES (Reuters)

“Sales of new U.S. single-family homes rose more than expected in August, but there are signs that housing market momentum is slowing as the tailwind from the COVID-19 pandemic fades. New home sales increased 1.5% to a seasonally adjusted annual rate of 740,000 units last month...” Story at...

https://www.reuters.com/article/usa-economy-housing/u-s-new-home-sales-beat-expectations-in-august-idUSL1N2QP203


OIL ABOUT TO BREAKOUT FROM ITS LONGTERM DOWNTREND? (Felder Report)

“There is a compelling case to be made for favoring value stocks today. Among those, the energy sector remains the most compelling by a long shot. In addition to being cheap, it’s really the only sector within the broad market where insiders continue to be very bullish (the broad market, in contrast, continues to be sold by the smartest of the smart money). So it would appear that insiders believe oil prices are likely to breakout above critical resistance represented by the upper trend line of its long-term downtrend channel.”

https://thefelderreport.com/2021/09/22/is-oil-about-to-breakout-of-its-long-term-downtrend/

My cmt: I am still holding the XLE-ETF. The dividend remains nearly 4%.


RECORD NUMBER OF CARGO SHIPS STUCK OUTSIDE LA (msn.com)

“The bottleneck this week at America’s busiest port complex [LA and Long Beach] is the result of a shortage of trucks and drivers to pick up goods, coupled with an overwhelming demand for imported consumer products. As of Wednesday, 62 container ships were waiting offshore to unload cargo, according to the Marine Exchange of Southern California.” Story at...

A record number of cargo ships are stuck outside LA. What’s happening? (msn.com)

“The trucking industry has about 80,000 fewer available drivers today compared to a year ago.” From...

https://www.atbs.com/post/where-did-all-the-truck-drivers-go

The usual suspects: retirement eligible drivers left; older drivers feared COVID and retired early; fearing Covid, many took unemployment and  stayed  home.


CORONAVIRUS (NTSM)

Here’s the latest from the COVID19 Johns Hopkins website as of 7:00 PM Friday. U.S. total case numbers are on the left axis; daily numbers are on the right side of the graph in Red with the 10-dMA of daily numbers in Green.


I added the smoothed 10-dMA of new cases (in purple) to the chart.


MARKET REPORT / ANALYSIS

-Friday the S&P 500 rose about 0.2% to 4455.

-VIX dropped about 5% to 17.75.

-The yield on the 10-year Treasury rose to 1.454%.


Bull signs continue.


The Friday run-down of some important indicators turned bullish (7-bear and 10

-bull). These indicators tend to be both long-term and short-term, so they are different than the 20 that I report on daily. Details follow:


BULL SIGNS

-The smoothed advancing volume on the NYSE is rising.

-There have been 6 Statistically-Significant days in the last 15-days. This can be a bull or bear signal. Coming off the bottom – this is bullish.

-The 10-dMA % of issues advancing on the NYSE (Breadth) is above 50%.

-The 100-dMA % of issues advancing on the NYSE (Breadth) is above 50%.

-MACD of the percentage of issues advancing on the NYSE (breadth) made a bullish crossover 23 September.

-My Money Trend indicator.

-McClellan Oscillator.

-The Smart Money (late-day action) indicates the Pros are bulish. (This indicator is based on the Smart Money Indicator developed by Don Hayes).

-21 and 22 Sept were high up-volume days. Bullish

-The S&P 500 is out-performing the Utilities ETF (XLU).


NEUTRAL

-Distribution Days.  There have been 1 in the last 25-days, not enough to send a signal.

-The S&P 500 is 8.0% above its 200-dMA (Bear indicator is 12%.). This value was 15.9% above the 200-dMA when the 10% correction occurred in Sep 2020.

-Bollinger Bands

-RSI.

-Breadth on the NYSE compared to the S&P 500 index is neutral.

-Calm-before-the-Storm Indicator – expired.

-There have been 9 up-days over the last 20 days. Neutral

-There have been 5 up-days over the last 10-days. Neutral

-There was a Follow-thru day on 15 Sept.  This cancels any prior Distribution days, but the signal has expired.

-The Fosback High-Low Logic Index is neutral.

-7.7% of all issues traded on the NYSE made new, 52-week highs when the S&P 500 made a new all-time-high 2 September. (There is no bullish signal for this indicator.) This is above the average for all-time highs and suggests that if we do have a pullback, it is likely to be less than 10%.

-Overbought/Oversold Index (Advance/Decline Ratio) is neutral.

-The size of up-moves has been larger than the size of down-moves over the last month, but not enough to give a signal.

-Statistically, the S&P 500 gave a panic-signal 17 Sept. Signal has expired.

-Non-crash Sentiment indicator remains neutral, but it is very bullish and that means the signal is leaning bearish.

-21 Sep, the 52-week, New-high/new-low ratio improved by 0.2 standard deviations, somewhat bullish, but neutral.

-VIX is falling, but not fast enough to send a signal. This is one of my more reliable indicators.

-There were 5 Hindenburg Omen signals 16-23 Aug.  The McClellan Oscillator turned positive afterward, so the Omens have been cancelled.

-49% (and headed higher) of the 15-ETFs that I track have been up over the last 10-days.


BEAR SIGNS

-The 50-dMA % of issues advancing on the NYSE (Breadth) is below 50%, but just barely.

-MACD of S&P 500 price made a bearish crossover, 9 September.

-Long-term new-high/new-low data is down.

-Short-term new-high/new-low data is falling.

-Slope of the 40-dMA of New-highs is down. This is one of my favorite trend indicators.

-Cyclical Industrials (XLI-ETF) are under-performing the S&P 500.

-The 5-10-20 Timer System is SELL; the 5-dEMA and 10-dEMA are both below the 20-dEMA. It’s improving, but still in the bear side.  


On Friday, 21 February, 2 days after the top of the Coronavirus pullback, there were 10 bear-signs and 1 bull-sign. Now there are 7 bear-signs and 10 bull-signs. Last week, there were 14 bear-signs and 3 bull-signs.


This week’s reading has switched to the bull side. It’s not a hugely bullish signal, but considering where it was last week and the number of indicators headed higher (even though they are now bearish) I think this is a good result for the bulls.  I bumped my stocks holdings to 55% of the portfolio.


Looks like new highs are ahead.  


The daily sum of 20 Indicators improved from -3 to -1 (a positive number is bullish; negatives are bearish); the 10-day smoothed sum that smooths the daily fluctuations improved from -77 to -73 (These numbers sometimes change after I post the blog based on data that comes in late.) Most of these indicators are short-term and many are trend following.


The Long Term NTSM indicator ensemble remained HOLD. Volume, VIX, Price & Sentiment indicators are neutral.


I’m bullish. Today’s results were further confirmation that the “bottom” was Tuesday. Now we’ll need to see what the market looks like when it makes a new-high.
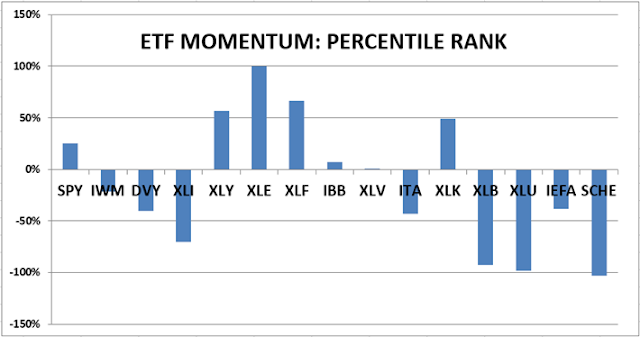
 

MOMENTUM ANALYSIS:

TODAY’S RANKING OF 15 ETFs (Ranked Daily)

The top ranked ETF receives 100%. The rest are then ranked based on their momentum relative to the leading

ETF.


*For additional background on the ETF ranking system see NTSM Page at…

http://navigatethestockmarket.blogspot.com/p/exchange-traded-funds-etf-ranking.html


TODAY’S RANKING OF THE DOW 30 STOCKS (Ranked Daily)

Here’s the revised DOW 30 and its momentum analysis. The top ranked stock receives 100%. The rest are then ranked based on their momentum relative to the leading stock.

For more details, see NTSM Page at…

https://navigatethestockmarket.blogspot.com/p/a-system-for-trading-dow-30-stocks-my_8.html


FRIDAY MARKET INTERNALS (NYSE DATA)

Market Internals remained NEUTRAL on the market.


Market Internals are a decent trend-following analysis of current market action, but should not be used alone for short term trading. They are usually right, but they are often late.  They are most useful when they diverge from the Index. 


My stock-allocation in the portfolio is now about 55% invested in stocks; this is slightly above my “normal” fully invested allocation of 50%.


You may wish to have a higher or lower % invested in stocks depending on your risk tolerance. 50% is a conservative position that I consider fully invested for most retirees.


As a general rule, some suggest that the % of portfolio invested in the stock market should be one’s age subtracted from 100.  So, a 30-year-old person would have 70% of the portfolio in stocks, stock mutual funds and/or stock ETFs.  That’s ok, but for older investors, I usually don’t recommend keeping less than 50% invested in stocks (as a fully invested position) since most people need some growth in the portfolio to keep up with inflation.