“Trade what you see; not what you think.” – The Old Fool,
Richard McCranie, trader extraordinaire.
CHICAGO PMI (Advisor Perspectives)
“The latest Chicago Purchasing Manager's Index, or the Chicago Business Barometer, rose to 44.9 in December from 37.2 in November, which is still in contraction territory. It has spent 1/3 of 2022 in contraction territory. Values above 50.0 indicate expanding manufacturing activity.” Story at...
https://www.advisorperspectives.com/dshort/updates/2022/12/30/chicago-pmi-rises-in-december
BREADTH ISN’T SUGGESTING A BIG DOWNTURN RIGHT NOW (NTSM)
 Breadth (% of stocks advancing on the NYSE) has been
holding its own recently, so currently, it is not looking too bad. We still
need to see it above 50% to feel bullish.
Breadth (% of stocks advancing on the NYSE) has been
holding its own recently, so currently, it is not looking too bad. We still
need to see it above 50% to feel bullish.
MARKET REPORT / ANALYSIS
-Friday the S&P 500 slipped about 0.3% to 3840.
-VIX rose about 1% to 21.67
-The yield on the 10-year Treasury rose to 3.880%.
PULLBACK DATA:
-Drop from Top: 20% as of today. 25.4% max (on a closing basis).
-Trading Days since Top: 250-days.
The S&P 500 is 4.2% BELOW its 200-dMA & 1.5% BELOW its 50-dMA.
*I won’t call the correction over until the S&P 500 makes a new-high; however, evidence suggests the bottom was in the 3600 area.
MY TRADING POSITIONS:
I am doing less trading now. You may do better watching the momentum charts rather than my moves.
XLK – Technology ETF. (I’ve been waiting for tech to take
off. Not sure we’re there yet but Thursday’s
move higher was nice to see.)
TODAY’S COMMENT:
It still appears that the most likely scenario will see the S&P 500 test its October lows.
On Fridays, I summarize a number of indicators to get a
weekly feel for trend. The Friday rundown of indicators improved some, but
still leans bearish (13-bear and 9-bull). These indicators tend to be both
long-term and short-term, so they are different than the 20 that I report on
daily.
BULL SIGNS
-The 50-dMA percentage of issues advancing on the NYSE (Breadth) is above 50%.
-My Money Trend indicator is improving.
-Short-term new-high/new-low data.
-Long-term new-high/new-low data.
-There have only been 7 up-days over the last 20 sessions – bullish.
-The graph of the 100-day Count (the 100-day sum of up-days) has turned up sharply.
-The Smart Money (late-day action).
-VIX indicator. (VIX is falling fast enough to be bullish.)
-XLI-ETF (Cyclical Industrials) is outperforming the S&P 500.
NEUTRAL
-Bollinger Bands.
-Issues advancing on the NYSE (Breadth) compared to the S&P 500.
-On average, the size of up-moves has been larger than the size of down-moves over the last month, but not enough to send a signal.
-The 50-dMA percentage of issues advancing on the NYSE (Breadth) has been above 50%, for 3 days in a row ending the “correction-now” signal.
-Overbought/Oversold Index (Advance/Decline Ratio).
-The short-term, 10-day, Fosback Hi-Low Logic Index.
-The longer-term, 50-dEMA, Fosback Hi-Low Logic Index is neutral.
-There have been 4 up-days over the last 10 sessions – neutral.
-RSI
-There have only been 2 Statistically-Significant days (big moves in price-volume) in the last 15-days.
-Sentiment.
- 90% up-volume days - the last one was down - neutral.
-The Calm-before-the-Storm/Panic Indicator flashed a panic-buying signal 10 November - expired.
-The S&P 500 is 4.2% below its 200-dMA. (Bull indicator is 12% below the 200-day, although this is based on “normal” pullbacks.)
-There was an Inverse Zweig Breadth Collapse (negative Breadth Thrust) 21 June. That’s a rare, very-bearish sign, but it was a long time ago - expired.
-There was a Hindenburg Omen signal 8 April – expired.
-2.8% of all issues traded on the NYSE made new, 52-week highs when the S&P 500 made a new all-time-high, 3 January 2022. (There is no bullish signal for this indicator.) This indicated that the advance was too narrow and a correction was likely to be >10%. It proved correct, but is now Expired
-The 52-week, New-high/new-low ratio improved by 3.5 standard deviations. More simply, the spread between new-highs and new-lows improved by 716 on 14 October. That’s a solid bottom sign at a retest. – Expired.
-13 & 21 Oct were Bullish Outside Reversal Days with no Bearish Outside Reversal days since then - expired.
BEAR SIGNS
-The smoothed advancing volume on the NYSE is falling.
-The 10-dMA percentage of issues advancing on the NYSE (Breadth) is below 50%.
-The 100-dMA percentage of issues advancing on the NYSE (Breadth) is below 50%
-MACD of the percentage of issues advancing on the NYSE (breadth) made a bearish crossover 15 Dec.
-Smoothed Buying Pressure minus Selling Pressure is falling, but not by much.
-MACD of S&P 500 price made a bearish crossover 6 Dec.
-McClellan Oscillator.
-Slope of the 40-dMA of New-highs is down.
-There have been 7 Distribution Days since the last follow-thru day.
-The 5-10-20 Timer System is SELL; the 5-dEMA and 10-dEMA are both below the 20-dEMA.
-The 5-day EMA is below the 10-day EMA so short-term momentum is bearish.
-S&P 500 is underperforming the Utilities (XLU), but the spread is getting more bullish. I’ll call it bear for now.
-45% of the 15-ETFs that I track have been up over the last 10-days.
On Friday, 21 February, 2 days after the top before the
Coronavirus pullback, there were 10 bear-signs and 1 bull-sign. Now there
are 13 bear-sign and 9-Bull. Last week, there were 13 bear-sign and 6
bull-signs.
Today, the daily sum of 20 Indicators increased from +2
to +7 (a positive number is bullish; negatives are bearish); the 10-day
smoothed sum that smooths the daily fluctuations increased from +29 to 35. (The
trend direction is more important than the actual number for the 10-day value.)
These numbers sometimes change after I post the blog based on data that comes
in late. Most of these 20 indicators are short-term so they tend to bounce
around a lot.
LONG-TERM INDICATOR: The Long Term NTSM indicator remained
HOLD: PRICE & SENTIMENT are neutral; VIX is positive; VOLUME is
negative.
Bottom line: I’m a Bear at this point. I am defensively
positioned in the markets, but not drastically so. The 50-dMA is the key for
me; if the S&P 500 can climb above its 50-dMA and remain for consecutive days,
I’ll be adding to stock holdings. There was a successful test and buy signal 27
September, so I need to be careful not to get too bearish. Perhaps cautious is
a better word than bearish.
I’m now have about 40% of the portfolio invested in
stocks. (As a retiree, 50% invested in stocks is my “normal” portfolio.) I was
75% invested in stocks in early December.
BEST ETFs - MOMENTUM ANALYSIS:
TODAY’S RANKING OF 15 ETFs (Ranked Daily)
ETF ranking follows:

*For additional background on the ETF ranking system see NTSM Page at…
http://navigatethestockmarket.blogspot.com/p/exchange-traded-funds-etf-ranking.html
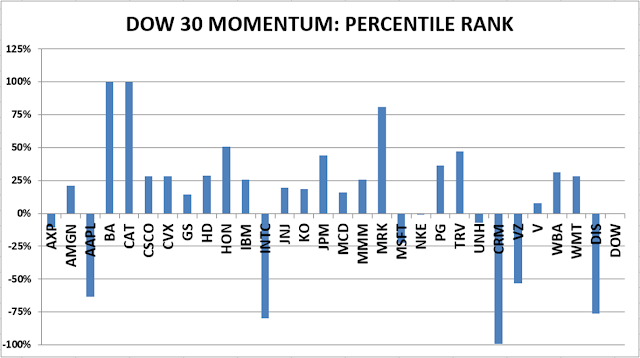
BEST DOW STOCKS - TODAY’S MOMENTUM
RANKING OF THE DOW 30 STOCKS (Ranked Daily)
DOW 30 momentum ranking follows:
 The top ranked Stock receives
100%. The rest are then ranked based on their momentum relative to the leading Stock.
The top ranked Stock receives
100%. The rest are then ranked based on their momentum relative to the leading Stock.
For more details, see NTSM Page at…
https://navigatethestockmarket.blogspot.com/p/a-system-for-trading-dow-30-stocks-my_8.html
FRIDAY MARKET INTERNALS (NYSE
DATA)
 My basket of Market Internals remained HOLD. (Market Internals are a
decent trend-following analysis of current market action, but should not be
used alone for short term trading. They are most useful when they diverge from
the Index.)
My basket of Market Internals remained HOLD. (Market Internals are a
decent trend-following analysis of current market action, but should not be
used alone for short term trading. They are most useful when they diverge from
the Index.)

...My current invested
position is about 40% stocks, including stock mutual funds and ETFs. I’m
usually about 50% invested in stocks. Last week’s Friday-run-down indicator
ensemble was bad enough to convince me to take a more conservative view of the
markets.
I trade about 15-20% of the
total portfolio using the momentum-based analysis I provide here. If I can see
a definitive bottom, I’ll add a lot more stocks to the portfolio using an
S&P 500 ETF.
“The latest Chicago Purchasing Manager's Index, or the Chicago Business Barometer, rose to 44.9 in December from 37.2 in November, which is still in contraction territory. It has spent 1/3 of 2022 in contraction territory. Values above 50.0 indicate expanding manufacturing activity.” Story at...
https://www.advisorperspectives.com/dshort/updates/2022/12/30/chicago-pmi-rises-in-december
-Friday the S&P 500 slipped about 0.3% to 3840.
-VIX rose about 1% to 21.67
-The yield on the 10-year Treasury rose to 3.880%.
-Drop from Top: 20% as of today. 25.4% max (on a closing basis).
-Trading Days since Top: 250-days.
The S&P 500 is 4.2% BELOW its 200-dMA & 1.5% BELOW its 50-dMA.
*I won’t call the correction over until the S&P 500 makes a new-high; however, evidence suggests the bottom was in the 3600 area.
I am doing less trading now. You may do better watching the momentum charts rather than my moves.
It still appears that the most likely scenario will see the S&P 500 test its October lows.
-The 50-dMA percentage of issues advancing on the NYSE (Breadth) is above 50%.
-My Money Trend indicator is improving.
-Short-term new-high/new-low data.
-Long-term new-high/new-low data.
-There have only been 7 up-days over the last 20 sessions – bullish.
-The graph of the 100-day Count (the 100-day sum of up-days) has turned up sharply.
-The Smart Money (late-day action).
-VIX indicator. (VIX is falling fast enough to be bullish.)
-XLI-ETF (Cyclical Industrials) is outperforming the S&P 500.
-Bollinger Bands.
-Issues advancing on the NYSE (Breadth) compared to the S&P 500.
-On average, the size of up-moves has been larger than the size of down-moves over the last month, but not enough to send a signal.
-The 50-dMA percentage of issues advancing on the NYSE (Breadth) has been above 50%, for 3 days in a row ending the “correction-now” signal.
-Overbought/Oversold Index (Advance/Decline Ratio).
-The short-term, 10-day, Fosback Hi-Low Logic Index.
-The longer-term, 50-dEMA, Fosback Hi-Low Logic Index is neutral.
-There have been 4 up-days over the last 10 sessions – neutral.
-RSI
-There have only been 2 Statistically-Significant days (big moves in price-volume) in the last 15-days.
-Sentiment.
- 90% up-volume days - the last one was down - neutral.
-The Calm-before-the-Storm/Panic Indicator flashed a panic-buying signal 10 November - expired.
-The S&P 500 is 4.2% below its 200-dMA. (Bull indicator is 12% below the 200-day, although this is based on “normal” pullbacks.)
-There was an Inverse Zweig Breadth Collapse (negative Breadth Thrust) 21 June. That’s a rare, very-bearish sign, but it was a long time ago - expired.
-There was a Hindenburg Omen signal 8 April – expired.
-2.8% of all issues traded on the NYSE made new, 52-week highs when the S&P 500 made a new all-time-high, 3 January 2022. (There is no bullish signal for this indicator.) This indicated that the advance was too narrow and a correction was likely to be >10%. It proved correct, but is now Expired
-The 52-week, New-high/new-low ratio improved by 3.5 standard deviations. More simply, the spread between new-highs and new-lows improved by 716 on 14 October. That’s a solid bottom sign at a retest. – Expired.
-13 & 21 Oct were Bullish Outside Reversal Days with no Bearish Outside Reversal days since then - expired.
-The smoothed advancing volume on the NYSE is falling.
-The 10-dMA percentage of issues advancing on the NYSE (Breadth) is below 50%.
-The 100-dMA percentage of issues advancing on the NYSE (Breadth) is below 50%
-MACD of the percentage of issues advancing on the NYSE (breadth) made a bearish crossover 15 Dec.
-Smoothed Buying Pressure minus Selling Pressure is falling, but not by much.
-MACD of S&P 500 price made a bearish crossover 6 Dec.
-McClellan Oscillator.
-Slope of the 40-dMA of New-highs is down.
-There have been 7 Distribution Days since the last follow-thru day.
-The 5-10-20 Timer System is SELL; the 5-dEMA and 10-dEMA are both below the 20-dEMA.
-The 5-day EMA is below the 10-day EMA so short-term momentum is bearish.
-S&P 500 is underperforming the Utilities (XLU), but the spread is getting more bullish. I’ll call it bear for now.
-45% of the 15-ETFs that I track have been up over the last 10-days.
BEST ETFs - MOMENTUM ANALYSIS:
TODAY’S RANKING OF 15 ETFs (Ranked Daily)
ETF ranking follows:
*For additional background on the ETF ranking system see NTSM Page at…
http://navigatethestockmarket.blogspot.com/p/exchange-traded-funds-etf-ranking.html
DOW 30 momentum ranking follows:
For more details, see NTSM Page at…
https://navigatethestockmarket.blogspot.com/p/a-system-for-trading-dow-30-stocks-my_8.html