“Trade what you see; not what you think.” – The Old Fool,
Richard McCranie, trader extraordinaire.
FED BEIGE BOOK (fxstreet)
“According to Federal Reserve’s Beige Book, “economic
activity was little changed overall in April and early May”. The expectations
for future growth deteriorated a little, “though contacts still largely
expected a further expansion in activity...Prices rose moderately over
the reporting period, though the rate of increase slowed in many Districts.”
Story at...
https://www.fxstreet.com/news/feds-beige-book-economic-activity-was-little-changed-overall-in-april-and-early-may-202305311807
CHICAGO PMI (Advisor Perspectives)
“The latest Chicago Purchasing Manager's Index (Chicago Business
Barometer) regressed to 40.4 in May from 48.6 in April. This is the ninth
straight month in contraction territory. This reading comes in below the
forecast of 47.0.”
Chart and commentary at...
https://www.advisorperspectives.com/dshort/updates/2023/05/31/chicago-pmi-regresses-to-six-month-low?topic=covid-19-coronavirus-coverage
JOLTS – JOB OPENINGS (YahooFinance)
The latest Job Opening and Labor Turnover Survey, or
JOLTs report, released Wednesday revealed 10.1 million job openings at
the end of April, an increase from the 9.8 million in job openings reported in
March... Oxford Economics wrote in a note on Wednesday. "While
there are some concerns over the veracity of the JOLTS survey due to
historically low response rates, the upshot remains that labor market strength
remains robust.” Story at...
https://finance.yahoo.com/news/job-openings-show-surprise-increase-in-april-142039924.html
MARKET REPORT / ANALYSIS
-Wednesday the S&P 500 dipped about 0.6% to 4180.
-VIX rose about 3% to 17.94.
-The yield on the 10-year Treasury slipped to 3.647%.
PULLBACK DATA:
-Drop from Top: 12.9%. 25.4% max (on a closing basis).
-Trading Days since Top: 353-days.
The S&P 500 is 5.1% ABOVE its 200-dMA and 1.7%
ABOVE its 50-dMA.
*I won’t call the correction over until the S&P 500
makes a new-high; however, evidence suggests the bottom was in the 3600 area
and we called a buy on 4 October 2022.
MY TRADING POSITIONS:
I am not trading as much as in the past. You may wish to
use the momentum charts and/or the Monday 40-day gain charts for trading the
Dow stocks and ETFs.
MSFT – Microsoft.
XLK – Technology ETF.
XLE – Energy Sector ETF. XLE tested its March low on 16
May on lower volume so I continue to hold it.
XLY - Consumer Discretionary ETF.
KRE – Regional Banking ETF. This is a very small position
for me. KRE tested the May 4 low of 36.08 on much lower volume 11 & 12
May.
SHY – Short term bonds. 30-day yield is 4%. (Trailing
1-year yield is 1.6%.) I’ll hold this, but if the market retests the lows, I’ll
sell it and buy stocks.)
TODAY’S COMMENT:
Utilities/S&P 500 spread over the longer term is
still bullish, however, today utilities outperformed the S&P 500 by a lot. It’s
a trend to watch, but it is not telling us much now.
The S&P 500 has been drifting down and is now only
1.7% above its 50-dMA. I’ll get worried
if it breaks below it.
Today, (Wednesday) unchanged volume was very high. As I’ve
often said, many believe that this indicator suggests investor confusion at
market turning points. The S&P 500 has been trending higher for about 2
months, but not very strongly. It hasn’t gone anywhere in the last month, so it’s
hard to determine the current trend. With the Debt Ceiling Debacle ongoing, it
may just be indicating investor confusion. The Long Term NTSM ensemble remains
hold and the most recent Friday summary of indicators was 13 Bull to 7 Bear,
suggesting that the appropriate action at this point is to wait and see.
The daily spread of 20 Indicators (Bulls minus Bears) improved
from -6 to -3 (a positive number is bullish; negatives are bearish); the 10-day
smoothed sum that smooths the daily fluctuations declined from -18 to -21.
(The trend direction is more important than the actual number for the 10-day
value.) These numbers sometimes change after I post the blog based on data that
comes in late. Most of these 20 indicators are short-term so they tend to
bounce around a lot.
LONG-TERM INDICATOR: The Long Term NTSM indicator
remained HOLD: PRICE is positive; SENTIMENT, VIX & VOLUME are neutral.
(The important BUY in this indicator was on 21 October,
7-days after the bottom. For my NTSM overall signal, I suggested that a
short-term buying opportunity occurred on 27 September (based on improved
market internals on the retest), although without market follow-thru, I was
unwilling to call a buy; however, I did close shorts and increased stock
holdings. I issued a Buy-Signal on 4 October, 6-days before the final bottom,
based on stronger market action that confirmed the market internals signal. The
NTSM sell-signal was issued 20 December, 8 sessions before the high of this
recent bear market, based on the bearish “Friday Rundown” of indicators.)
Bottom line: I remain a Bull.
ETF - MOMENTUM ANALYSIS:
TODAY’S RANKING OF 15 ETFs (Ranked
Daily)
ETF ranking follows:
The top ranked ETF receives
100%. The rest are then ranked based on their momentum relative to the leading
ETF.
*For additional background on
the ETF ranking system see NTSM Page at…
http://navigatethestockmarket.blogspot.com/p/exchange-traded-funds-etf-ranking.html
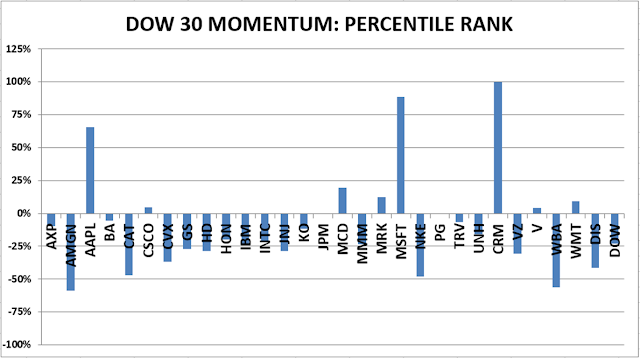
DOW STOCKS - TODAY’S MOMENTUM RANKING
OF THE DOW 30 STOCKS (Ranked Daily)
DOW 30 momentum ranking
follows:
The top ranked Stock receives
100%. The rest are then ranked based on their momentum relative to the leading Stock.
For more details, see NTSM
Page at…
https://navigatethestockmarket.blogspot.com/p/a-system-for-trading-dow-30-stocks-my_8.html
WEDNESDAY MARKET INTERNALS
(NYSE DATA)
My basket of Market Internals remained HOLD. (Market Internals are a
decent trend-following analysis of current market action, but should not be
used alone for short term trading. They are most useful when they diverge from
the Index.)
...My current invested
position is about 65% stocks, including stock mutual funds and ETFs. I’m
usually about 50% invested in stocks.
I trade about 15-20% of the
total portfolio using the momentum-based analysis I provide here. If I can see
a definitive bottom, I’ll add a lot more stocks to the portfolio using an
S&P 500 ETF.
“Trade what you see; not what you think.” – The Old Fool,
Richard McCranie, trader extraordinaire.
THE PHONY DEBT CEILING CALAMITY (WSJ)
“With the U.S. Treasury predicted to run out of cash (the
“X date”) as early as June 1, Treasury Secretary Janet Yellen has
started warning of an “economic calamity” if Congress doesn’t raise the
statutory debt limit...These claims are dangerously misleading.
Hitting the X date won’t cause a default on the national
debt. Debt-service payments have a feature that most other government payments
lack: When the government pays off maturing debt, the amount of debt subject to
the statutory limit declines. This means that the government can “roll over”
such obligations—that is, issue new debt to pay off old debt—without violating
the debt limit.
...It is a matter of public record that the Treasury made
such a plan during a 2011 showdown over the debt limit, when one official
explained that “the principal on Treasury securities that are maturing would be
funded by having auctions that would roll over those maturing securities into
new issues, so the new issues would be able to fund the redemption of the
maturing securities.”
For a similar reason, hitting the X date need not stop
Social Security and other payments that come from federal trust funds....
...The X date still presents uncertainty, and we don’t
want to appear pollyannaish. But...it may well be that hitting the X date—and a
short lapse in the government’s ability to raise revenue—looks like a temporary
government shutdown that follows an appropriations lapse.” - Conor J. Clarke and Kristin A. Shapiro. Mr. Clarke is an incoming
associate professor at the Washington University in St. Louis School of Law.
Ms. Shapiro practices appellate and constitutional law in Washington and is a
senior fellow at the Independent Women’s Forum.
FULL Commentary at...
https://www.wsj.com/articles/the-phony-debt-ceiling-calamity-x-date-default-social-security-roll-over-treasury-ac939d83
My cmt: When I began working in Government, the permits
program was included in the same appropriation as Operation & Maintenance
of civil works facilities such as dams, locks, or bridges. When there was a
threat of appropriation shortfall, my boss would direct that we cut the Permits
Program so the public would be impacted and would harass Congress to increase
funding. But there were plenty of cuts that could have been made with no impact
to the public. For example, we could
have deferred some maintenance on various projects. The same BS is going on now. If the debt
ceiling isn’t raised, spending on discretionary projects could be delayed, such
as the Infrastructure Bill (among others), so that Social Security and other
non-discretionary expenditures would continue until a debt ceiling agreement
could be reached. But cutting Social Security scares people, so that’s all we
hear about.
CONSUMER CONFIDENCE (Conference Board)
“Consumer confidence declined in May as consumers’ view
of current conditions became somewhat less upbeat while their expectations
remained gloomy... While consumer confidence has fallen across all age and
income categories over the past three months, May’s decline reflects a
particularly notable worsening in the outlook among consumers over 55 years of
age.” Report at...
https://www.conference-board.org/topics/consumer-confidence/press/CCI-May-2023
PE RATIOS FOR THE S&P 500 (multpl.com)
“Current S&P 500 PE
Ratio: 24.34 +0.31 (1.30%)
4:00
PM EDT, Fri May 26
|
Mean:
|
16.01
|
|
|
Median:
|
14.93
|
|
|
Min:
|
5.31
|
(Dec 1917)
|
|
Max:
|
123.73
|
(May 2009)
|
Price to earnings ratio, based on trailing twelve month
“as reported” earnings.”
Chart from...
https://www.multpl.com/s-p-500-pe-ratio
My cmt: We keep hearing Pundits suggest that high PEs
will derail the current rally, but PEs were much higher before the 2000 dot.com
crash - around 34. (The extreme highs in the above chart were during recessions
when earnings fell faster than prices.) It seems to me that PEs can go much
higher than they are now. There are more
investors chasing fewer stocks. I don’t remember much from Econ I, but when
demand is strong and supply is low, prices go up.
MARKET REPORT / ANALYSIS
-Tuesday the S&P 500 was little changed at 4206.
-VIX slipped about 3% to 17.48.
-The yield on the 10-year Treasury slipped to 3.703%.
PULLBACK DATA:
-Drop from Top: 12.3%. 25.4% max (on a closing basis).
-Trading Days since Top: 352-days.
The S&P 500 is 5.8% ABOVE its 200-dMA and 2.4%
ABOVE its 50-dMA.
*I won’t call the correction over until the S&P 500
makes a new-high; however, evidence suggests the bottom was in the 3600 area
and we called a buy on 4 October 2022.
MY TRADING POSITIONS:
I am not trading as much as in the past. You may wish to
use the momentum charts and/or the Monday 40-day gain charts for trading the
Dow stocks and ETFs.
MSFT – Microsoft.
XLK – Technology ETF.
XLE – Energy Sector ETF. XLE tested its March low on 16
May on lower volume so I continue to hold it.
XLY - Consumer Discretionary ETF.
KRE – Regional Banking ETF. This is a very small position
for me. KRE tested the May 4 low of 36.08 on much lower volume 11 & 12
May.
SHY – Short term bonds. 30-day yield is 4%. (Trailing
1-year yield is 1.6%.) I’ll hold this, but if the market retests the lows, I’ll
sell it and buy stocks.)
TODAY’S COMMENT:
Breadth continues to be stubbornly weak. The 10-dMA of the % of issues advancing on
the NYSE remains below 50% and today it dropped to 47.2%. The good news is
that, so far, both the 50-day and 100-day moving averages remain above
50%. 50% is an important benchmark because,
if the moving average drops below 50%, it means that less than half of all
issues have gone up over the time frame of the moving average. Stated more
simply, over the last 2 weeks most issues have gone down.
The daily spread of 20 Indicators (Bulls minus Bears) declined
from -3 to -6 (a positive number is bullish; negatives are bearish); the 10-day
smoothed sum that smooths the daily fluctuations declined from -14 to -18.
(The trend direction is more important than the actual number for the 10-day
value.) These numbers sometimes change after I post the blog based on data that
comes in late. Most of these 20 indicators are short-term so they tend to
bounce around a lot.
LONG-TERM INDICATOR: The Long Term NTSM indicator
remained HOLD: PRICE is positive; SENTIMENT, VIX & VOLUME are neutral.
(The important BUY in this indicator was on 21 October,
7-days after the bottom. For my NTSM overall signal, I suggested that a
short-term buying opportunity occurred on 27 September (based on improved
market internals on the retest), although without market follow-thru, I was
unwilling to call a buy; however, I did close shorts and increased stock
holdings. I issued a Buy-Signal on 4 October, 6-days before the final bottom,
based on stronger market action that confirmed the market internals signal. The
NTSM sell-signal was issued 20 December, 8 sessions before the high of this
recent bear market, based on the bearish “Friday Rundown” of indicators.)
Bottom line: I remain a Bull.
ETF - MOMENTUM ANALYSIS:
TODAY’S RANKING OF 15 ETFs
(Ranked Daily)
ETF ranking follows:
The top ranked ETF receives
100%. The rest are then ranked based on their momentum relative to the leading
ETF.
*For additional background on
the ETF ranking system see NTSM Page at…
http://navigatethestockmarket.blogspot.com/p/exchange-traded-funds-etf-ranking.html
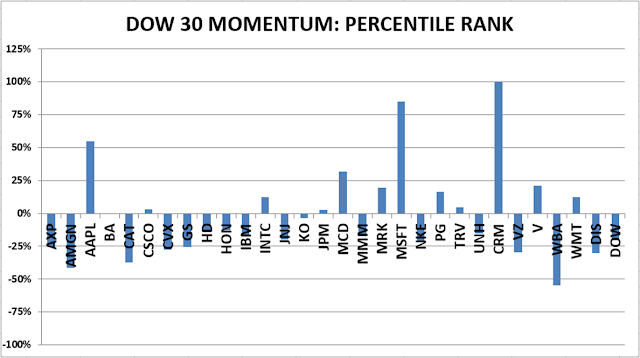
DOW STOCKS - TODAY’S MOMENTUM RANKING
OF THE DOW 30 STOCKS (Ranked Daily)
DOW 30 momentum ranking
follows:
The top ranked Stock receives
100%. The rest are then ranked based on their momentum relative to the leading Stock.
For more details, see NTSM
Page at…
https://navigatethestockmarket.blogspot.com/p/a-system-for-trading-dow-30-stocks-my_8.html
TUESDAY MARKET INTERNALS (NYSE
DATA)
My basket of Market Internals
remained HOLD. (Market Internals are a decent
trend-following analysis of current market action, but should not be used alone
for short term trading. They are most useful when they diverge from the Index.)
...My current invested
position is about 65% stocks, including stock mutual funds and ETFs. I’m
usually about 50% invested in stocks.
I trade about 15-20% of the
total portfolio using the momentum-based analysis I provide here. If I can see
a definitive bottom, I’ll add a lot more stocks to the portfolio using an
S&P 500 ETF.
“Trade what you see; not what you think.” – The Old Fool,
Richard McCranie, trader extraordinaire.
CONSUMER SPENDING (Seeking Alpha)
“Consumers increased their spending in April, by 0.8% from
March, double the +0.4% expected and strengthening from the 0.1% increase in
March... Real consumer spending, which is adjusted for inflation, increased
0.5% in April, up from 0.0% in March. That "resilient rebound" is
"another sign that the economy
refuses to go gently into that good night," Joseph Brusuelas, RSM US chief
economist, said via tweet.”
Story at...
https://seekingalpha.com/news/3975401-personal-spending-jumps-in-april-pce-inflation-ticks-up-from-march
PCE PRICES (Morningstar)
“The increase in the personal consumption expenditures
index was a tick higher than the Wall Street forecast. The PCE index is the
Federal Reserve's preferred inflation barometer. The yearly increase in prices
rose to 4.4% from 4.2% in the prior month...the core PCE index, which omits
food and energy, suggests the progress in reducing inflation may have stalled.
It also rose 0.4% last month.” Story at...
https://www.morningstar.com/news/marketwatch/20230526358/us-prices-rise-sharply-pce-shows-in-sign-fight-vs-inflation-has-stalled
DURABLE ORDERS (Morningstar)
“Orders for U.S. manufactured goods jumped 1.1% in April
largely because of the military, but business investment also rose sharply in a
positive sign for the economy.” Story at...
https://www.morningstar.com/news/marketwatch/20230526423/durable-goods-orders-get-a-boost-from-military-spending
UNIV OF MICHIGAN SENTIMENT – FINAL (Univ of Michigan)
“Consumer sentiment slid 7% amid worries about the path
of the economy, erasing nearly half of the gains achieved after the all-time
historic low from last June. This decline mirrors the 2011 debt ceiling crisis,
during which sentiment also plunged. This month, sentiment fell severely for
consumers in the West and those with middle incomes. The year-ahead economic
outlook plummeted 17% from last month. Long-run expectations plunged by 13% as
well, indicating that consumers are concerned that any recession to come may
cause lasting pain.” Story at...
http://www.sca.isr.umich.edu/
MARKET REPORT / ANALYSIS
-Friday the S&P 500 rose about 1.3% to 4205.
-VIX slipped about 6% to 17.95.
-The yield on the 10-year Treasury slipped to 3.806%.
PULLBACK DATA:
-Drop from Top: 12.3%. 25.4% max (on a closing basis).
-Trading Days since Top: 351-days.
The S&P 500 is 5.8% ABOVE its 200-dMA and 2.6%
ABOVE its 50-dMA.
*I won’t call the correction over until the S&P 500
makes a new-high; however, evidence suggests the bottom was in the 3600 area
and we called a buy on 4 October 2022.
MY TRADING POSITIONS:
I am not trading as much as in the past. You may wish to
use the momentum charts and/or the Monday 40-day gain charts for trading the
Dow stocks and ETFs.
MSFT – Microsoft. Current PE 36.1 Historic PE:
Chart from...
https://www.macrotrends.net/stocks/charts/MSFT/microsoft/pe-ratio
XLK – Technology ETF.
XLE – Energy Sector ETF. XLE tested its March low on 16
May on lower volume so I continue to hold it.
XLY - Consumer Discretionary ETF.
KRE – Regional Banking ETF. This is a very small position
for me. KRE tested the May 4 low of 36.08 on much lower volume 11 & 12
May.
SHY – Short term bonds. 30-day yield is 4%. (Trailing
1-year yield is 1.6%.) I’ll hold this, but if the market retests the lows, I’ll
sell it and buy stocks.)
TODAY’S COMMENT:
Here’s my weekly review of indicators:
The weekly rundown of indicators slipped more to the bear
side, but remained bullish overall (now 7-bear and 13-bull). (These indicators
tend to be both long-term and short-term, so they are different than the 20
that I report on daily.)
BULL SIGNS
-The smoothed advancing volume on the NYSE is rising.
-The 50-dMA percentage of issues advancing on the NYSE
(Breadth) is above 50%.
-The 100-dMA percentage of issues advancing on
the NYSE (Breadth) is above 50%.
-MACD of the percentage of issues advancing on the NYSE
(breadth) made a bullish crossover 19 May.
-Smoothed Buying Pressure minus Selling Pressure is rising.
-MACD of S&P 500 price made a bullish crossover 26
May.
-Short-term new-high/new-low data.
-The graph of the 100-day Count (the 100-day sum of
up-days) is moving higher.
-On average, the size of up-moves has been larger than
the size of down-moves over the last month.
-The 5-10-20 Timer System is BUY.
-The 5-day EMA is above the 10-day EMA so short-term
momentum is bullish.
-S&P 500 spread vs. Utilities (XLU-ETF).
-Slope of the 40-dMA of New-highs is rising but not by
much.
NEUTRAL
-There was a Distribution Day 23 May. – Neutral.
-There have been 3 Statistically-Significant days (big
moves in price-volume) in the last 15-days.
-Sentiment.
-The 50-dMA percentage of issues advancing on the NYSE (Breadth)
has not been below 50%, for more than 3 days in a row.
-Overbought/Oversold Index (Advance/Decline Ratio).
-Bollinger Band Squeeze 28 April - expired.
-The long-term, 50-dEMA, Fosback Hi-Low Logic Index is
neutral.
-The short-term, 10-day EMA, Fosback Hi-Low Logic Index
is neutral.
-There have been 6 up-days over the last 10 sessions – neutral.
-There have been 9 up-days over the last 20 sessions -
neutral.
-RSI
-VIX indicator.
-There was a 90% down-volume day 9 March.
-There was a Hindenburg Omen signal 3 May 2023. The
McClellan Oscillator turned positive 18 May. – Expired.
-The S&P 500 is 5.8% above its 200-dMA. (Bear
indicator is 12% above the 200-day.)
-There was a Zweig Breadth Thrust 31 March. That’s a
rare, very-bullish sign, but the McClellan Oscillator turned negative, so this
indicator has expired.
-The Calm-before-the-Storm/Panic Indicator flashed a
panic-buying signal 10 November - expired.
-2.8% of all issues traded on the NYSE made new, 52-week
highs when the S&P 500 made a new all-time-high, 3 January 2022. (There is
no bullish signal for this indicator.) This indicated that the advance was too
narrow and a correction was likely to be >10%. It proved correct, but is now
Expired.
-10 May there was a Bullish Outside Reversal Day –
Expired.
-47% of the 15-ETFs that I track have been up over the
last 10-days.
BEAR SIGNS
-The 10-dMA percentage of issues advancing on
the NYSE (Breadth) is below 50%.
-Issues advancing on the NYSE (Breadth) compared to the
S&P 500. The Index is too far ahead of Breadth.
-My Money Trend indicator is falling.
-Long-term new-high/new-low data.
-McClellan Oscillator.
-The Smart Money (late-day action) is pointing down.
-XLI-ETF (Cyclical Industrials) is underperforming the
S&P 500.
On Friday, 21 February, 2 days after the top before the
Coronavirus pullback, there were 10 bear-signs and 1 bull-sign. Now there
are 7 bear-signs and 13-Bull. Last week, there were 6 bear-sign and 18
bull-signs.
The daily spread of 20 Indicators (Bulls minus Bears) improved
from -10 to -3 (a positive number is bullish; negatives are bearish); the
10-day smoothed sum that smooths the daily fluctuations declined from -11
to -14. (The trend direction is more important than the actual number for the
10-day value.) These numbers sometimes change after I post the blog based on
data that comes in late. Most of these 20 indicators are short-term so they
tend to bounce around a lot.
LONG-TERM INDICATOR: The Long Term NTSM indicator
remained HOLD: PRICE is positive; SENTIMENT, VIX & VOLUME are neutral.
(The important BUY in this indicator was on 21 October,
7-days after the bottom. For my NTSM overall signal, I suggested that a
short-term buying opportunity occurred on 27 September (based on improved market
internals on the retest), although without market follow-thru, I was unwilling
to call a buy; however, I did close shorts and increased stock holdings. I
issued a Buy-Signal on 4 October, 6-days before the final bottom, based on
stronger market action that confirmed the market internals signal. The NTSM
sell-signal was issued 20 December, 8 sessions before the high of this recent
bear market, based on the bearish “Friday Rundown” of indicators.)
Bottom line: I remain a Bull.
ETF - MOMENTUM ANALYSIS:
TODAY’S RANKING OF 15 ETFs
(Ranked Daily)
ETF ranking follows:
The top ranked ETF receives
100%. The rest are then ranked based on their momentum relative to the leading
ETF.
*For additional background on
the ETF ranking system see NTSM Page at…
http://navigatethestockmarket.blogspot.com/p/exchange-traded-funds-etf-ranking.html
DOW STOCKS - TODAY’S MOMENTUM RANKING
OF THE DOW 30 STOCKS (Ranked Daily)
DOW 30 momentum ranking
follows:
The top ranked Stock receives
100%. The rest are then ranked based on their momentum relative to the leading Stock.
For more details, see NTSM
Page at…
https://navigatethestockmarket.blogspot.com/p/a-system-for-trading-dow-30-stocks-my_8.html
FRIDAY MARKET INTERNALS (NYSE
DATA)
My basket of Market Internals improved to HOLD. (Market Internals are a
decent trend-following analysis of current market action, but should not be
used alone for short term trading. They are most useful when they diverge from
the Index.)
...My current invested
position is about 65% stocks, including stock mutual funds and ETFs. I’m
usually about 50% invested in stocks.
I trade about 15-20% of the
total portfolio using the momentum-based analysis I provide here. If I can see
a definitive bottom, I’ll add a lot more stocks to the portfolio using an
S&P 500 ETF.
“Trade what you see; not what you think.” – The Old Fool,
Richard McCranie, trader extraordinaire.
“Under the current approach to journalism, it is the New
York Times that receives a Pulitzer for a now debunked Russian collusion story
rather than the New York Post for a now proven Hunter Biden laptop story.” –
Jonathan Turley, Shapiro Chair for Public Interest Law at The George
Washington University Law School, where he teaches torts, criminal procedure, and constitutional law. Commentary
at...
https://jonathanturley.org/
JOBLESS CLAIMS (YahooFinance)
“The number of Americans filing new claims for
unemployment benefits rose moderately last week and the prior week's data was
revised sharply lower, suggesting persistent labor market strength. Initial
claims for state unemployment benefits increased 4,000 to a seasonally adjusted
229,000 for the week ended May 20...” Story at...
https://finance.yahoo.com/news/u-weekly-jobless-claims-rise-124306917.html
GDP – 2ND EST (The Hill)
“First-quarter gross domestic product (GDP) was revised
up on Thursday as the long-predicted recession following the blistering
economic recovery from the pandemic once again failed to hit the U.S. economy. GDP
was corrected up 0.2 percentage points to a gain of 1.3 percent in the first
quarter...” Story at...
https://thehill.com/homenews/4020869-first-quarter-gdp-revised-up-as-corporate-profits-give-way-to-labor-share/
MARKET REPORT / ANALYSIS
-Thursday the S&P 500 rose about 0.9% to 4151.
-VIX slipped about .9% to 19.14.
-The yield on the 10-year Treasury rose to 3.822%.
PULLBACK DATA:
-Drop from Top: 13.5%. 25.4% max (on a closing basis).
-Trading Days since Top: 350-days.
The S&P 500 is 4.4% ABOVE its 200-dMA and 1.4%
ABOVE its 50-dMA.
*I won’t call the correction over until the S&P 500
makes a new-high; however, evidence suggests the bottom was in the 3600 area
and we called a buy on 4 October 2022.
MY TRADING POSITIONS:
I am not trading as much as in the past. You may wish to
use the momentum charts and/or the Monday 40-day gain charts for trading the
Dow stocks and ETFs.
MSFT – Microsoft.
XLK – Technology ETF.
XLE – Energy Sector ETF. XLE tested its March low on 16
May on lower volume so I continue to hold it.
XLY - Consumer Discretionary ETF.
KRE – Regional Banking ETF. This is a very small position
for me. KRE tested the May 4 low of 36.08 on much lower volume 11 & 12
May.
SHY – Short term bonds. 30-day yield is 4%. (Trailing
1-year yield is 1.6%.) I’ll hold this, but if the market retests the lows, I’ll
sell it and buy stocks.)
TODAY’S COMMENT:
The 200-day moving average of the S&P 50 turned down yesterday
and reversed upward today. I don’t think this is a particularly telling indicator.
I’d be more concerned if the S&P 500 fell below its 200-dMA.
The S&P 500 is still too far ahead of issues trading
on the NYSE, suggesting that the Index may experience some continued weakness.
I would not be surprised to see the index dip to around the 4000 level, but I
doubt that we’ll see much of a drop,
barring unforeseen bad news.
The daily spread of 20 Indicators (Bulls minus Bears) declined
from -9 to -11 (a positive number is bullish; negatives are bearish); the
10-day smoothed sum that smooths the daily fluctuations declined from -2
to -11. (The trend direction is more important than the actual number for the
10-day value.) These numbers sometimes change after I post the blog based on
data that comes in late. Most of these 20 indicators are short-term so they
tend to bounce around a lot.
LONG-TERM INDICATOR: The Long Term NTSM indicator remained
HOLD: PRICE is positive; SENTIMENT, VIX & VOLUME are neutral.
(The important BUY in this indicator was on 21 October,
7-days after the bottom. For my NTSM overall signal, I suggested that a
short-term buying opportunity occurred on 27 September (based on improved
market internals on the retest), although without market follow-thru, I was
unwilling to call a buy; however, I did close shorts and increased stock
holdings. I issued a Buy-Signal on 4 October, 6-days before the final bottom,
based on stronger market action that confirmed the market internals signal. The
NTSM sell-signal was issued 20 December, 8 sessions before the high of this
recent bear market, based on the bearish “Friday Rundown” of indicators.)
Bottom line: I remain a Bull.
ETF - MOMENTUM ANALYSIS:
TODAY’S RANKING OF 15 ETFs
(Ranked Daily)
ETF ranking follows:
The top ranked ETF receives
100%. The rest are then ranked based on their momentum relative to the leading
ETF.
*For additional background on
the ETF ranking system see NTSM Page at…
http://navigatethestockmarket.blogspot.com/p/exchange-traded-funds-etf-ranking.html
DOW STOCKS - TODAY’S MOMENTUM RANKING
OF THE DOW 30 STOCKS (Ranked Daily)
DOW 30 momentum ranking
follows:
The top ranked Stock receives
100%. The rest are then ranked based on their momentum relative to the leading Stock.
For more details, see NTSM
Page at…
https://navigatethestockmarket.blogspot.com/p/a-system-for-trading-dow-30-stocks-my_8.html
THURSDAY MARKET INTERNALS
(NYSE DATA)
My basket of Market Internals remained SELL. (Market Internals are a
decent trend-following analysis of current market action, but should not be
used alone for short term trading. They are most useful when they diverge from
the Index.)
...My current invested
position is about 65% stocks, including stock mutual funds and ETFs. I’m
usually about 50% invested in stocks.
I trade about 15-20% of the
total portfolio using the momentum-based analysis I provide here. If I can see
a definitive bottom, I’ll add a lot more stocks to the portfolio using an
S&P 500 ETF.
“Trade what you see; not what you think.” – The Old Fool,
Richard McCranie, trader extraordinaire.
“Despite impressive
efforts at spinning the findings by the media, the Durham
Report highlighted two scandals. First, there was a comprehensive effort of the
political and media establishments to perpetrate one of the great hoaxes in
history — a political hit job that ultimately derailed an American presidency.
Second, there was no real accountability for that effort for the main players
from Clinton to Comey to Congress. It was much like The Murder on the Orient
Express. The question is not “whodunit” but who didn’t do it.
Spoiler alert: they all did it so no one was punished.” – Jonathan Turley, Shapiro
Chair for Public Interest Law at The George
Washington University Law School, where he teaches torts, criminal procedure, and constitutional law. Commentary at...
https://jonathanturley.org/
FOMC (FED) MINUTES (Benzinga)
"The minutes of the May 2-3 FOMC meeting revealed
uncertainty about how much more policy tightening may be appropriate,
with some FOMC participants warning that a
failure to raise the federal debt limit in a timely manner will
threaten significant financial system disruptions and lead to tighter financial conditions... The economic forecast prepared
by the staff for the May FOMC meeting forecasted a mild recession starting
later this year, followed by a modestly paced recovery.” Story at...
https://www.benzinga.com/economics/macro-economic-events/23/05/32555812/fed-may-not-be-done-hiking-interest-rates-missing-the-debt-ceiling-deadline-will-
CRUDE INVENTORIES (EIA)
“U.S. commercial crude oil inventories (excluding those
in the Strategic Petroleum Reserve) decreased by 12.5 million barrels from the
previous week. At 455.2 million barrels, U.S. crude oil inventories are 3%
below the five year average for this time of year.” Report at...
https://ir.eia.gov/wpsr/wpsrsummary.pdf
MARKET REPORT / ANALYSIS
-Wednesday the S&P 500 fell about 0.7% to 4115.
-VIX rose about 9% to 20.12.
-The yield on the 10-year Treasury rose to 3.750%.
PULLBACK DATA:
-Drop from Top: 14.2%. 25.4% max (on a closing basis).
-Trading Days since Top: 348-days.
The S&P 500 is 3.5% ABOVE its 200-dMA and 0.6%
ABOVE its 50-dMA.
*I won’t call the correction over until the S&P 500
makes a new-high; however, evidence suggests the bottom was in the 3600 area
and we called a buy on 4 October 2022.
MY TRADING POSITIONS:
I am not trading as much as in the past. You may wish to
use the momentum charts and/or the Monday 40-day gain charts for trading the
Dow stocks and ETFs.
MSFT – Microsoft.
XLK – Technology ETF.
XLE – Energy Sector ETF. XLE tested its March low on 16
May on lower volume so I continue to hold it.
XLY - Consumer Discretionary ETF.
KRE – Regional Banking ETF. This is a very small position
for me. KRE tested the May 4 low of 36.08 on much lower volume 11 & 12
May.
SHY – Short term bonds. 30-day yield is 4%. (Trailing
1-year yield is 1.6%.) I’ll hold this, but if the market retests the lows, I’ll
sell it and buy stocks.)
TODAY’S COMMENT:
The S&P 500 is now only 0.6% above its 50-dMA. It
looks like the 50-dMA may not hold, just based on my guess.
The next line of support may be the lower trend line. There’s
always some guess work in drawing trend lines – it all depends on the scales
used in the charts. The current Lower, trend line looks like it is around 4000.
That’s about 2.5% below where the S&P 500 closed Wednesday. That’s where this dip may settle if the Index
doesn’t hold the 50-dMA. That is roughly half way between the 100-dMA and the
200-dMA.
200-day moving average of the S&P 50 turned down
today. It had been rising since 30 March 2023.
The daily spread of 20 Indicators (Bulls minus Bears) declined
from -4 to -9 (a positive number is bullish; negatives are bearish); the 10-day
smoothed sum that smooths the daily fluctuations declined from +13 to -2.
(The trend direction is more important than the actual number for the 10-day
value.) These numbers sometimes change after I post the blog based on data that
comes in late. Most of these 20 indicators are short-term so they tend to
bounce around a lot.
LONG-TERM INDICATOR: The Long Term NTSM indicator remained
HOLD: PRICE is positive; SENTIMENT, VIX & VOLUME are neutral.
(The important BUY in this indicator was on 21 October,
7-days after the bottom. For my NTSM overall signal, I suggested that a
short-term buying opportunity occurred on 27 September (based on improved
market internals on the retest), although without market follow-thru, I was
unwilling to call a buy; however, I did close shorts and increased stock
holdings. I issued a Buy-Signal on 4 October, 6-days before the final bottom,
based on stronger market action that confirmed the market internals signal. The
NTSM sell-signal was issued 20 December, 8 sessions before the high of this
recent bear market, based on the bearish “Friday Rundown” of indicators.)
Bottom line: I remain a Bull.
ETF - MOMENTUM ANALYSIS:
TODAY’S RANKING OF 15 ETFs
(Ranked Daily)
ETF ranking follows:
The top ranked ETF receives
100%. The rest are then ranked based on their momentum relative to the leading
ETF.
*For additional background on
the ETF ranking system see NTSM Page at…
http://navigatethestockmarket.blogspot.com/p/exchange-traded-funds-etf-ranking.html
DOW STOCKS - TODAY’S MOMENTUM RANKING
OF THE DOW 30 STOCKS (Ranked Daily)
DOW 30 momentum ranking
follows:
The top ranked Stock receives
100%. The rest are then ranked based on their momentum relative to the leading Stock.
For more details, see NTSM
Page at…
https://navigatethestockmarket.blogspot.com/p/a-system-for-trading-dow-30-stocks-my_8.html
WEDNESDAY MARKET INTERNALS
(NYSE DATA)
My basket of Market Internals declined to SELL. (Market Internals are a
decent trend-following analysis of current market action, but should not be
used alone for short term trading. They are most useful when they diverge from
the Index.)
...My current invested
position is about 65% stocks, including stock mutual funds and ETFs. I’m
usually about 50% invested in stocks.
I trade about 15-20% of the
total portfolio using the momentum-based analysis I provide here. If I can see
a definitive bottom, I’ll add a lot more stocks to the portfolio using an
S&P 500 ETF.
“Trade what you see; not what you think.” – The Old Fool,
Richard McCranie, trader extraordinaire.
IHS MARKIT COMPOSITE PMI (S&P Global US Composite
PMI)
“Companies in the US registered a solid upturn in
business activity during May, according to the latest ‘flash’ PMI™ data from
S&P Global. Overall growth in output was the fastest for just over a year.
The expansion was led by service providers, however, as manufacturers recorded
only a slight rise in production. The headline S&P Global Flash US PMI
Composite Output Index registered 54.5 in May, up from 53.4 in April, to signal
a solid and faster expansion in private sector business activity. The rise in
output was the sharpest since April 2022, but led by service providers, who
reported stronger demand conditions. Although manufacturers registered growth
in production, it was only marginal and slowed from the previous survey
period.” Report at...
https://www.pmi.spglobal.com/Public/Home/PressRelease/fb16b048c1ca4d659e136ae0c52faaa2
My cmt: What recession? It’s not in this report.
TALKING DEBT CEILING (Heritage Capital)
“While everyone knows the debt ceiling will be raised
this time as it has all previous times, it is one of the few times where the
opposition party has some power. Although these types of negotiations belong in
the budget process, the party in power never seems to want the minority to
engage at that point because a simple majority wins that vote. It is painful to
watch, but it’s still the best system around. Democrats point to three
straight, clean debt ceiling increases under Donald Trump. Republicans counter
that Joe Biden and Chuck Schumer are both on record as demanding negotiations
and compromise when they were Senators from the minority party...worst case, I
can see a BREXIT type decline, 4-6% in short, sharp fashion. If that occurs,
buy it with both hands.” Commentary at...
https://investfortomorrow.com/blog/still-talking-debt-ceiling-but-pga-was-the-story/
MARKET REPORT / ANALYSIS
-Tuesday the S&P 500 fell about 1.1% to 4146.
-VIX rose about 8% to 18.53.
-The yield on the 10-year Treasury dipped slightly to 3.701%.
PULLBACK DATA:
-Drop from Top: 13.6%. 25.4% max (on a closing basis).
-Trading Days since Top: 348-days.
The S&P 500 is 4.3% ABOVE its 200-dMA and 1.5%
ABOVE its 50-dMA.
*I won’t call the correction over until the S&P 500
makes a new-high; however, evidence suggests the bottom was in the 3600 area
and we called a buy on 4 October 2022.
MY TRADING POSITIONS:
I am not trading as much as in the past. You may wish to
use the momentum charts and/or the Monday 40-day gain charts for trading the
Dow stocks and ETFs.
MSFT – Microsoft.
XLK – Technology ETF.
XLE – Energy Sector ETF. XLE
tested its March low on 16 May on lower volume so I continue to hold it. XLE is
up about 4% since then.
XLY - Consumer Discretionary ETF.
KRE – Regional Banking ETF. This is a very small position
for me. KRE tested the May 4 low of 36.08 on much lower volume 11 & 12
May. It’s up about 10% since then.
SHY – Short term bonds. 30-day yield is 4%. (Trailing
1-year yield is 1.6%.) I’ll hold this, but if the market retests the lows, I’ll
sell it and buy stocks.)
TODAY’S COMMENT:
Listen to the Pundits on CNBC and you would be sure that
high PEs will derail the current rally.
PEs are nowhere near extremes we saw in 2000 before the dot.com
crash. Now, there are more investors
chasing fewer stocks so PEs can go much higher than seems reasonable. I don’t
think we are in a bubble yet.
Divergences mentioned during the CNBC Halftime Report are
more troubling. Only certain sectors
have been pulling this market along and breadth has been weak, according to the
pundits. I’ve mentioned one sign of divergence over the last couple of days; issues
advancing on the NYSE (Breadth) vs. the S&P 500 is still leaning bearish.
Currently, the S&P 500 is advancing too far ahead of other issues on the
NYSE. That’s a concern, but Breadth has been improving.
The 50-dMA of issues advancing on the NYSE improved and
has now risen above 50%. The 10-dMA of issues advancing on the NYSE was 53% 3
days ago although it has dipped to 49.6% today.
The point here is that overall breadth has been improving. Small caps
(Russel 2000) have outperformed other issues over the last few days.
I don’t see any reason why markets can’t go higher, other
than Debt Ceiling angst; we just have to wait and see where that mess is
going.
Today was a statistically significant down-day. That just
means that the price-volume move exceeded my statistical parameters. Statistics
show that a statistically-significant, down-day is followed by an up-day about
60% of the time.
The daily spread of 20 Indicators (Bulls minus Bears) declined
from -1 to -4 (a positive number is bullish; negatives are bearish); the 10-day
smoothed sum that smooths the daily fluctuations declined from +21 to +13.
(The trend direction is more important than the actual number for the 10-day
value.) These numbers sometimes change after I post the blog based on data that
comes in late. Most of these 20 indicators are short-term so they tend to
bounce around a lot.
LONG-TERM INDICATOR: The Long Term NTSM indicator declined
to HOLD: PRICE is positive; SENTIMENT, VIX & VOLUME are neutral.
(The important BUY in this indicator was on 21 October,
7-days after the bottom. For my NTSM overall signal, I suggested that a
short-term buying opportunity occurred on 27 September (based on improved
market internals on the retest), although without market follow-thru, I was
unwilling to call a buy; however, I did close shorts and increased stock
holdings. I issued a Buy-Signal on 4 October, 6-days before the final bottom,
based on stronger market action that confirmed the market internals signal. The
NTSM sell-signal was issued 20 December, 8 sessions before the high of this
recent bear market, based on the bearish “Friday Rundown” of indicators.)
Bottom line: I remain a Bull. I would add to stock
holdings, except that I am concerned about the Debt Ceiling negotiations. They
haven’t bothered the markets yet. That
may change as the deadline approaches.
ETF - MOMENTUM ANALYSIS:
TODAY’S RANKING OF 15 ETFs
(Ranked Daily)
ETF ranking follows:
The top ranked ETF receives
100%. The rest are then ranked based on their momentum relative to the leading
ETF.
*For additional background on
the ETF ranking system see NTSM Page at…
http://navigatethestockmarket.blogspot.com/p/exchange-traded-funds-etf-ranking.html
DOW STOCKS - TODAY’S MOMENTUM RANKING
OF THE DOW 30 STOCKS (Ranked Daily)
DOW 30 momentum ranking
follows:
The top ranked Stock receives
100%. The rest are then ranked based on their momentum relative to the leading Stock.
For more details, see NTSM
Page at…
https://navigatethestockmarket.blogspot.com/p/a-system-for-trading-dow-30-stocks-my_8.html
TUESDAY MARKET INTERNALS (NYSE
DATA)
My basket of Market Internals remained HOLD. (Market Internals are a
decent trend-following analysis of current market action, but should not be
used alone for short term trading. They are most useful when they diverge from
the Index.)
...My current invested
position is about 65% stocks, including stock mutual funds and ETFs. I’m
usually about 50% invested in stocks.
I trade about 15-20% of the
total portfolio using the momentum-based analysis I provide here. If I can see
a definitive bottom, I’ll add a lot more stocks to the portfolio using an
S&P 500 ETF.