“Trade what you see; not what you think.” – The Old Fool,
Richard McCranie, trader extraordinaire.
PERSONAL INCOME / SPENDING
“Personal income increased $87.6 billion (0.4% at a
monthly rate) in August, according to estimates released by the Bureau of
Economic Analysis...” From...
https://www.floordaily.net/flooring-news/personal-income-and-spending-both-rose-04-in-august
PCE PRICES (Investopedia)
“Consumer prices, as measured by the personal consumption expenditures
(PCE) price index, rose 3.5% over the last 12 months as of August,
up from 3.4% in July and 3.2% in June, the Bureau of Economic Analysis said
Friday. The increase was driven mostly by rising gas prices... “Core” PCE,
which excludes volatile prices for food and energy, rose just 0.1% in August,
making for a 3.9% increase over the year. The yearly change was down from 4.3%
in July and the lowest since May 2021...” Story at...
https://www.investopedia.com/rising-gas-prices-drive-fed-s-favorite-inflation-measure-up-for-a-third-month-8285911
CHICAGO PMI (Advisor Perpectives)
“The latest Chicago Purchasing Manager's Index (Chicago Business
Barometer) fell to 44.1 in September from 48.7 in August. The latest reading is
worse than the 47.6 forecast and marks the 13th straight month in contraction
territory.” Analysis at...
https://www.advisorperspectives.com/dshort/updates/2023/09/29/chicago-pmi-contracts-13-consecutive-months
MARKET REPORT / ANALYSIS
-Friday the S&P 500 dipped about 0.3% to 4288.
-VIX rose about 1% to 17.52.
-The yield on the 10-year Treasury declined to 4.579%.
PULLBACK DATA:
-Drop from Top: 10.6%. 25.4% max (on a closing basis).
-Trading Days since Top: 437-days.
The S&P 500 is 2.1% ABOVE its 200-dMA and 3.7%
BELOW its 50-dMA.
*I won’t call the correction over until the S&P 500
makes a new-high; however, evidence suggests the bottom was in the 3600 area
and we called a buy on 4 October 2022.
MY TRADING POSITIONS:
XLK – Technology ETF (holding since the October 2022
lows).
XLY - Consumer Discretionary ETF. (Holding since the
October 2022 lows - I bought more XLY Monday, 8/21.)
I took profits and then reestablished positions as
follows:
SPY – I bought a large position in the S&P 500
Friday, 8/14, in my 401k (it has limited choices).
XLE – Added Tuesday, 8/22.
SSO – 2x S&P 500 ETF. Added 8/24.
CSCO – added 9/5.
TODAY’S COMMENT:
I heard a discussion on CNBC yesterday by Bob Pisani where
he said that oversold conditions are not a signal to buy, but rather a
condition. For the most part, that’s
true in significant corrections. In a
big downturn, oversold conditions can last a long time. However, in smaller
corrections (as is the one we’re in now), oversold signals from Bollinger
Bands, RSI and other signs can be a good bottom indicator. As such, I think the
markets found a bottom in the 4275 range on 26 September. Today’s intraday low
tested that level and bounced higher, so that was one piece of good news today.
On 1 September, there were 22 Bull-indicators and Zero
Bear-indicators in my Friday summary of indicators. The Index is 5% lower since
then. It’s just a reminder that, for the
most part, indicators don’t foretell the future, they simply give us the direction
of trend in the moment.
We look at a summary of indicators on Friday: The weekly
rundown of indicators increased by 1
more bear signal (now 16-bear and 4-bull). (These indicators tend to be both
long-term and short-term, so they are different than the 20 that I report on
daily.)
BULL SIGNS
-The 100-dMA percentage of issues advancing on
the NYSE (Breadth) is above 50%.
-RSI.
-XLI-ETF (Cyclical Industrials) vs the S&P 500.
-S&P 500 spread vs. Utilities (XLU-ETF) shows the
Index outpacing Utilities.
NEUTRAL
-There 5 Distribution Days since 15 Sept. – Not enough to
send a message.
-There have been 4 Statistically-Significant days (big
moves in price-volume) in the last 15-days.
-Sentiment.
-Bollinger Band Squeeze 28 April - expired.
-Bollinger Bands.
-Overbought/Oversold Index (Advance/Decline Ratio).
-Issues advancing on the NYSE (Breadth) compared to the
S&P 500.
-10 August there was a Bullish Outside Reversal Day.
Expired
-The S&P 500 is 2.1% above its 200-dMA. (Bear
indicator is 12% above the 200-day.)
-The short-term, 10-day EMA, Fosback Hi-Low Logic Index.
-The long-term, 50-dEMA, Fosback Hi-Low Logic Index.
-There were Hindenburg Omen signals 11 & 12 Sept 2023
– expired. The McClellan Oscillator turned positive.
-There have been 4 up-days over the last 10 sessions.
-There have been 9 up-days over the last 20 sessions.
-There was a Zweig Breadth Thrust 31 March. That’s a
rare, very-bullish sign, but the McClellan Oscillator subsequently turned
negative, so this indicator has expired.
-The Calm-before-the-Storm/Panic Indicator flashed a top
warning signal 15 Sept., but it may well have been a bottom signal. But the
signal is partly due to volume from Options expiration. Call it neutral.
-VIX indicator.
-The Smart Money (late-day action).
-There was a 90% down-volume days 21 Sept, but only 1 so
far.
-2.8% of all issues traded on the NYSE made new, 52-week
highs when the S&P 500 made a new all-time-high, 3 January 2022. (There is
no bullish signal for this indicator.) This indicated that the advance was too
narrow and a correction was likely to be >10%. It proved correct, but is now
Expired.
-The graph of the 100-day Count (the 100-day sum of
up-days).
-There was a New-high/new-low reversal 29 September in the
morning, but the signal faded as the markets fell later in the day.
BEAR SIGNS
-The smoothed advancing volume on the NYSE is falling.
-The 10-dMA percentage of issues advancing on
the NYSE (Breadth) is below 50%.
-The 50-dMA percentage of issues advancing on the NYSE
(Breadth) is above 50%
-The 50-dMA percentage of issues advancing on the NYSE
(Breadth) has been below 50%, for more than 3 days in a row.
-MACD of the percentage of issues advancing on the NYSE
(breadth) made a bearish crossover 8 September.
-Smoothed Buying Pressure minus Selling Pressure.
-MACD of S&P 500 price made a bearish crossover 18
Sept.
-My Money Trend indicator is falling.
-Long-term new-high/new-low data.
-Short-term new-high/new-low data.
-Slope of the 40-dMA of New-highs is falling.
-McClellan Oscillator.
-On average, the size of up-moves has been significantly smaller
than the size of down-moves over the last month.
-The 5-10-20 Timer System is SELL.
-The 5-day EMA is below the 10-day EMA, so short-term
momentum is bearish.
-34% of the 15-ETFs that I track have been up over the
last 10-days. (45-55% is neutral.)
On Monday’s update of the Friday summary of indicators (20
December 2021), 9 days before the top of the current 25% correction, there were
21 bear-signs and zero bull-signs. Now there are 16 bear-signs and 4-Bull.
Last week, there were 15 bear-sign and 4 bull-signs.
The daily spread of 20 Indicators (Bulls minus Bears) improved
from -9 to -8 (a positive number is bullish; negatives are bearish); the 10-day
smoothed sum that smooths the daily fluctuations declined from -67 to -69.
(The trend direction is more important than the actual number for the 10-day
value.) These numbers sometimes change after I post the blog based on data that
comes in late. Most of these 20 indicators are short-term so they tend to
bounce around a lot.
LONG-TERM INDICATOR: The Long Term NTSM indicator
remained SELL: VOLUME & PRICE are bearish; SENTIMENT & VIX are neutral.
I’m not selling now. I’d prefer to hang on since I
am still expecting a relatively shallow pullback from August highs and if the
markets haven’t bottomed yet, they are not far from it.
(The important BUY in this indicator was on 21
October, 7-days after the bottom. For my NTSM overall signal, I suggested that
a short-term buying opportunity occurred on 27 September (based on improved
market internals on the retest), although without market follow-thru, I was
unwilling to call a buy; however, I did close shorts and increased stock
holdings. I issued a Buy-Signal on 4 October, 6-days before the final bottom,
based on stronger market action that confirmed the market internals signal. The
NTSM sell-signal was issued 21 December, 9 sessions before the high of this
recent bear market, based on the bearish “Friday Rundown” of indicators.)
I am still cautiously optimistic – The S&P 500 may
have bottomed, but I don’t see a confirmation in the indicators. Several indicators
appear to be reversing to the bullish side, but they’re not bullish yet. We’ll
have to see if that trend continues.
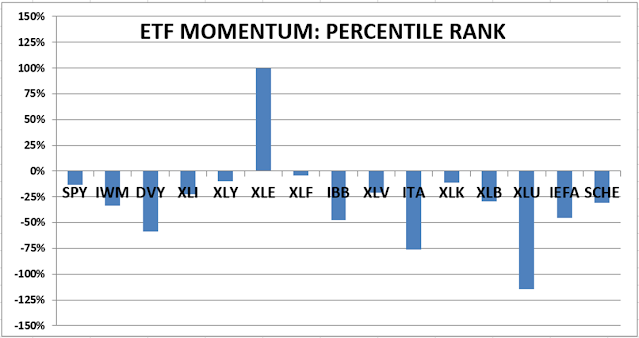
ETF - MOMENTUM ANALYSIS:
TODAY’S RANKING OF 15 ETFs
(Ranked Daily)
ETF ranking follows:
The top ranked ETF receives
100%. The rest are then ranked based on their momentum relative to the leading
ETF.
*For additional background on
the ETF ranking system see NTSM Page at…
http://navigatethestockmarket.blogspot.com/p/exchange-traded-funds-etf-ranking.html
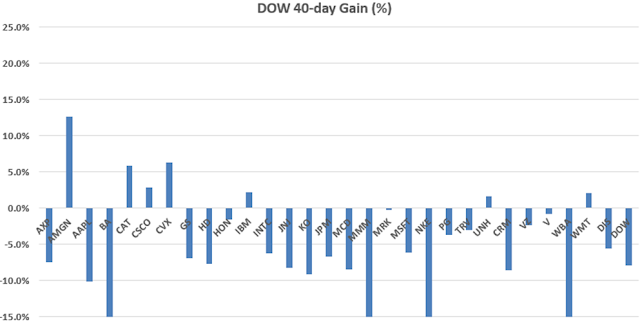
DOW STOCKS - TODAY’S MOMENTUM RANKING
OF THE DOW 30 STOCKS (Ranked Daily)
DOW 30 momentum ranking
follows:
The top ranked Stock receives
100%. The rest are then ranked based on their momentum relative to the leading Stock.
For more details, see NTSM
Page at…
https://navigatethestockmarket.blogspot.com/p/a-system-for-trading-dow-30-stocks-my_8.html
FRIDAY MARKET INTERNALS (NYSE
DATA)
My basket of Market Internals
remained SELL. (My basket of Market Internals is a decent trend-following analysis of
current market action, but should not be used alone for short term trading.
They are most useful when they diverge from the Index.)
...My current invested
position is about 75% stocks, including stock mutual funds and ETFs. I’m
usually about 50% invested in stocks. I’m “over invested” now expecting new,
all-time highs this year. That burns all the cash. I have about 25% of the portfolio in bonds.
I trade about 15-20% of the
total portfolio using the momentum-based analysis I provide here. When I see a
definitive bottom, I add a lot more stocks to the portfolio using an S&P
500 ETF as I did back in October.
“Trade what you see; not what you think.” – The Old Fool,
Richard McCranie, trader extraordinaire.
“UAW leadership claims GM pays its team members ‘poverty’
wages. This is simply not true.” – Mark Reuss, President General Motors.
...According to Reuss, the latest GM offer would give 85%
of union workers a base pay of $85,000.
"Only in 60% of episodes was inflation brought back
down (or 'resolved') within 5 years. Most unresolved episodes involved
'premature celebrations', where inflation declined initially, only to plateau
at an elevated level or re-accelerate." – Jesse Felder, co-founder of
Aletheia, a multi-billion-dollar hedge fund.
GDP – THIRD ESTIMATE (live mint)
“The real gross domestic product (GDP) of the United
States expanded at an annual rate of 2.1 per cent in the second quarter, the US
Bureau of Economic Analysis' (BEA) final estimate showed on Thursday, September
28. The reading came in line with the previous estimate and expectations by
economists on the Street.” Story at...
https://www.livemint.com/economy/us-real-gdp-grows-at-2-1-annual-rate-in-q2-in-line-with-street-estimates-weekly-jobless-claims-edge-higher-11695911236793.html
JOBLESS CLAIMS (Yahoo Finance)
“U.S. applications for unemployment benefits inched up
modestly this week after reaching their lowest level in eight months the
previous week...Filings for jobless claims rose by 2,000 to 204,000 for the
week ending Sept. 23, the Labor Department reported Thursday. Last week's
figure was the lowest since January.” Story at...
https://finance.yahoo.com/news/slightly-fewer-number-americans-apply-124006237.html
BACKLASH (MishTalk)
“There is an air of surrealism around the climate-change
debate in Britain and in much of Europe. The U.K. has dramatically reduced
carbon emissions over the past 30 years, thanks in significant part to
technological innovation. Its emissions per capita are now down to where they
were in the mid-19th century. The British government could mandate tomorrow the
elimination of all carbon emissions and a return to agrarian subsistence, and,
given the massive and rapidly rising levels of emissions from China, India and
elsewhere, it wouldn’t make the slightest difference to the climate.” Story
at...
https://mishtalk.com/economics/a-huge-backlash-against-climate-change-and-immigration-madness-has-started/
“One of the most significant advantages of an EV is that
they are safer for the environment. But is this true? If you look at the facts,
EVs are not zero-emission. They may have zero tailpipe emissions, but they are
certainly not pollution-free. EV batteries require mining materials like
lithium and cobalt, which harm the environment. EV batteries are also
complicated to recycle and dispose of, and new studies show that EV tires
produce 20% more pollution than gas-car tires. None of this screams “save the environment”
to me.” – Wealth of Geek$
MARKET REPORT / ANALYSIS
-Thursday the S&P 500 rose about 0.6% to 4300.
-VIX dipped about 5% to 17.34.
-The yield on the 10-year Treasury declined to 4.579%.
PULLBACK DATA:
-Drop from Top: 10.4%. 25.4% max (on a closing basis).
-Trading Days since Top: 436-days.
The S&P 500 is 2.4% ABOVE its 200-dMA and 3.5%
BELOW its 50-dMA.
*I won’t call the correction over until the S&P 500 makes
a new-high; however, evidence suggests the bottom was in the 3600 area and we
called a buy on 4 October 2022.
MY TRADING POSITIONS:
XLK – Technology ETF (holding since the October 2022
lows).
XLY - Consumer Discretionary ETF. (Holding since the October
2022 lows - I bought more XLY Monday, 8/21.)
I took profits and then reestablished positions as
follows:
SPY – I bought a large position in the S&P 500
Friday, 8/14, in my 401k (it has limited choices).
XLE – Added Tuesday, 8/22.
SSO – 2x S&P 500 ETF. Added 8/24.
CSCO – added 9/5.
TODAY’S COMMENT:
The Moving Average (MA) spread between Utilities
and the S&P 500 index indicates that the Index is outpacing Utilities. That’s a bullish sign and we see others, too.
Internals continue to improve. Advancers were twice
decliners and advancing volume was almost 3 times higher than declining volume.
New 52-week lows remained much worse than new 52-week highs, but the spread
between the highs and lows improved. Utilities was the only sector down – a bullish
sign.
The daily spread of 20 Indicators (Bulls minus Bears) improved
from -10 to -9 (a positive number is bullish; negatives are bearish); the
10-day smoothed sum that smooths the daily fluctuations declined from -61
to -67. (The trend direction is more important than the actual number for the
10-day value.) These numbers sometimes change after I post the blog based on
data that comes in late. Most of these 20 indicators are short-term so they
tend to bounce around a lot.
LONG-TERM INDICATOR: The Long Term NTSM indicator remained
SELL: VOLUME & PRICE are bearish; SENTIMENT & VIX are neutral.
I’m not selling now. I’d prefer to hang on since I
am still expecting a relatively shallow pullback from August highs and if the
markets haven’t bottomed yet, they are not far from it.
(The important BUY in this indicator was on 21 October,
7-days after the bottom. For my NTSM overall signal, I suggested that a
short-term buying opportunity occurred on 27 September (based on improved
market internals on the retest), although without market follow-thru, I was
unwilling to call a buy; however, I did close shorts and increased stock
holdings. I issued a Buy-Signal on 4 October, 6-days before the final bottom,
based on stronger market action that confirmed the market internals signal. The
NTSM sell-signal was issued 21 December, 9 sessions before the high of this
recent bear market, based on the bearish “Friday Rundown” of indicators.)
I am still cautiously optimistic – The S&P 500 appears to have bottomed, but I don’t see a confirmation in the indicators, yet.
ETF - MOMENTUM ANALYSIS:
TODAY’S RANKING OF 15 ETFs
(Ranked Daily)
ETF ranking follows:
The top ranked ETF receives
100%. The rest are then ranked based on their momentum relative to the leading
ETF.
*For additional background on
the ETF ranking system see NTSM Page at…
http://navigatethestockmarket.blogspot.com/p/exchange-traded-funds-etf-ranking.html
DOW STOCKS - TODAY’S MOMENTUM RANKING
OF THE DOW 30 STOCKS (Ranked Daily)
DOW 30 momentum ranking
follows:
The top ranked Stock receives
100%. The rest are then ranked based on their momentum relative to the leading Stock.
For more details, see NTSM
Page at…
https://navigatethestockmarket.blogspot.com/p/a-system-for-trading-dow-30-stocks-my_8.html
THURSDAY MARKET INTERNALS
(NYSE DATA)
My basket of Market Internals remained SELL. (My basket of Market
Internals is a decent trend-following analysis of current market action, but
should not be used alone for short term trading. They are most useful when they
diverge from the Index.)
...My current invested
position is about 75% stocks, including stock mutual funds and ETFs. I’m
usually about 50% invested in stocks. I’m “over invested” now expecting new,
all-time highs this year. That burns all the cash. I have about 25% of the portfolio in bonds.
I trade about 15-20% of the
total portfolio using the momentum-based analysis I provide here. When I see a
definitive bottom, I add a lot more stocks to the portfolio using an S&P
500 ETF as I did back in October.
“Trade what you see; not what you think.” – The Old Fool,
Richard McCranie, trader extraordinaire.
“I think leaders should endeavor to be honest, ethical,
moral people who try to set standards for themselves and lead by example across
the country. Donald Trump doesn’t try to do any of that. He does the opposite,
frankly. So I just don't think he's fit for the job here...The party that puts
the first fresh face forward wins this election.” - Paul Ryan, Republican,
Former Speaker of the House.
DURABLE ORDERS (Yahoo News)
“Durable
Goods Orders for August...more positive than expected and
in month-over-month comparisons: +0.2% is above the -0.5% consensus and the
downwardly revised -5.6% the previous month. ...now we see four out of five
months stronger... While these are heartening results for the health of the
economy...they do not assist the Fed in deciding that all rate hikes to the Fed
funds are over for the time being.” Story at...
https://finance.yahoo.com/news/durable-goods-orders-increase-august-144700775.html
CRUDE OIL INVENTORIES (EIA)
“U.S. commercial crude oil inventories (excluding those
in the Strategic Petroleum Reserve) decreased by 2.2 million barrels from the
previous week. At 416.3 million barrels, U.S. crude oil inventories are about
4% below the five year average for this time of year.” Report at...
https://ir.eia.gov/wpsr/wpsrsummary.pdf
TURNING POLUTION INTO RESOURCE (The Cool Down)
“A promising breakthrough in sustainable energy not only aims to
reduce pollution that harms the environment, it also aims to use that
pollution. Researchers from the Illinois Institute of Technology, the
University of Pennsylvania, and the University of Illinois, Chicago, have
developed a system that can convert carbon dioxide pollution into propane... Matteo
Cagnello, an assistant professor of chemical engineering at Stanford who
led similar research in 2019, described the closing of the
carbon cycle at the time, saying: “One can imagine a carbon-neutral cycle that produces
fuel from carbon dioxide and then burns it, creating new carbon dioxide that
gets turned back into fuel.” Story at...
Scientists
make breakthrough turning air pollution into resource for human use: ‘For the
benefit of global users’ (msn.com)
My cmt: The biggest problem with the climate-crisis panic
is that it ignores technologies that will solve the problem, such as the one
above and others like carbon capture, hydrogen fuel cells, advances in fusion
reactors and improvements in batteries. Let’s face it – if batteries were
smaller, lighter weight and more efficient, electric vehicles would be a
realistic competitor to gas powered vehicles (although it is questionable
whether electric vehicles will make any difference in global temperatures).
OIL COULD HIT $150 PER BARREL (NY Post)
“A top oil executive predicted that the price of crude
would continue to soar — climbing to as high as $150 per barrel — unless the government
adopts new policies to encourage more exploration. Doug Lawler — the CEO of
Continental Resources, a shale driller controlled by billionaire Harold Hamm —
warned that crude output in Texas’ Permian Basin oil field could soon peak, as
it already has in rival shale fields like North Dakota’s Bakken Formation and
Texas’ Eagle Ford.” Story at...
Shale
CEO warns oil could hit $150 per barrel (msn.com)
THE HEAT PUMP FARCE (The Telegraph / msn.com)
“The real problem with heat pumps is that they are not
yet effective enough, we have not worked out how to insulate our ageing housing
stock so they generate enough warmth, and even if we fixed those two issues we
most likely won’t generate enough electricity at reasonable cost to keep them
all running through the winter. The solution is very simple. Countries
around the world are developing new heat pump technology, and other “green”
home heating technologies are emerging all the time. Hydrogen might work, or
high-capacity batteries powered by domestic solar panels, or extracting warmer
water from underground. No one can say for sure yet. So we should wait and see.”
Story at...
The
heat pumps farce has reached a new low (msn.com)
My cmt: The US is mandating heat pumps in about half the
states. In Britain (article above), it’s
really crazy. They’re going to fine suppliers for not selling enough heat
pumps.
MARKET REPORT / ANALYSIS
-Wednesday the S&P 500 was little changed at 4275.
-VIX dipped about 4% to 18.22.
-The yield on the 10-year Treasury rose to 4.616%, a
continuing worry for the stock market.
PULLBACK DATA:
-Drop from Top: 10.9%. 25.4% max (on a closing basis).
-Trading Days since Top: 435-days.
The S&P 500 is 1.9% ABOVE its 200-dMA and 4.2%
BELOW its 50-dMA.
*I won’t call the correction over until the S&P 500
makes a new-high; however, evidence suggests the bottom was in the 3600 area
and we called a buy on 4 October 2022.
MY TRADING POSITIONS:
XLK – Technology ETF (holding since the October 2022
lows).
XLY - Consumer Discretionary ETF. (Holding since the
October 2022 lows - I bought more XLY Monday, 8/21.)
I took profits and then reestablished positions as
follows:
SPY – I bought a large position in the S&P 500
Friday, 8/14, in my 401k (it has limited choices).
XLE – Added Tuesday, 8/22.
SSO – 2x S&P 500 ETF. Added 8/24.
CSCO – added 9/5.
TODAY’S COMMENT:
Internals are finally improving, not enough to change
indicators much, but improving. Advancers outpaced decliners and advancing
volume was higher than declining volume. New 52-week lows remained much worse
than new 52-week highs, but that is not unusual. New-high/new-low data is
always last to turn.
This correction/bear market has lasted 435 days and
included a 25% drop from peak to trough.
If the bear market ended now (broke to new all-time highs) the closest
bear market in the last 75 years, statistically, would be the 1980-1982 bear
that saw a 28% decline. It lasted 444-days. The gain on the other side was 229%.
That doesn’t mean we’ll see that kind of rally this time, but usually after a
bear market, returns are very good. The average gain is about 85%. The
exception would be 1929 – I don’t even want to think about that possibility. It
is small, but not zero.
It was interesting that a CNBC investor survey showed
that two thirds of respondents thought that the market was in a bear market rally.
That seemed like a high level of bearish sentiment that is actually bullish.
The Russell 2000 was up nearly 1% today – I see that as a
bullish sign, too.
The daily spread of 20 Indicators (Bulls minus Bears) declined
from -6 to -10 (a positive number is bullish; negatives are bearish); the
10-day smoothed sum that smooths the daily fluctuations declined from -56
to -61. (The trend direction is more important than the actual number for the
10-day value.) These numbers sometimes change after I post the blog based on
data that comes in late. Most of these 20 indicators are short-term so they
tend to bounce around a lot.
LONG-TERM INDICATOR: The Long Term NTSM indicator remained
SELL: VOLUME, PRICE & VIX are bearish; SENTIMENT is neutral.
I’m not selling now. I’d prefer to hang on since I
am still expecting a relatively shallow pullback from August highs and if the
markets haven’t bottomed yet, they are not far from it.
(The important BUY in this indicator was on 21
October, 7-days after the bottom. For my NTSM overall signal, I suggested that
a short-term buying opportunity occurred on 27 September (based on improved
market internals on the retest), although without market follow-thru, I was
unwilling to call a buy; however, I did close shorts and increased stock
holdings. I issued a Buy-Signal on 4 October, 6-days before the final bottom,
based on stronger market action that confirmed the market internals signal. The
NTSM sell-signal was issued 21 December, 9 sessions before the high of this
recent bear market, based on the bearish “Friday Rundown” of indicators.)
The S&P 500 dipped to within 1/10% of its 200-dMA
today and bounced higher. I am still cautiously optimistic – I don’t think the
market has too much farther to go and it may have already bottomed.
ETF - MOMENTUM ANALYSIS:
TODAY’S RANKING OF 15 ETFs
(Ranked Daily)
ETF ranking follows:

The top ranked ETF receives
100%. The rest are then ranked based on their momentum relative to the leading
ETF.
*For additional background on
the ETF ranking system see NTSM Page at…
http://navigatethestockmarket.blogspot.com/p/exchange-traded-funds-etf-ranking.html
DOW STOCKS - TODAY’S MOMENTUM RANKING
OF THE DOW 30 STOCKS (Ranked Daily)
DOW 30 momentum ranking follows:
The top ranked Stock receives
100%. The rest are then ranked based on their momentum relative to the leading Stock.
For more details, see NTSM
Page at…
https://navigatethestockmarket.blogspot.com/p/a-system-for-trading-dow-30-stocks-my_8.html
WEDNESDAY MARKET INTERNALS
(NYSE DATA)
My basket of Market Internals remained SELL. (My basket of Market
Internals is a decent trend-following analysis of current market action, but
should not be used alone for short term trading. They are most useful when they
diverge from the Index.)
...My current invested
position is about 75% stocks, including stock mutual funds and ETFs. I’m
usually about 50% invested in stocks. I’m “over invested” now expecting new,
all-time highs this year. That burns all the cash. I have about 25% of the portfolio in bonds.
I trade about 15-20% of the
total portfolio using the momentum-based analysis I provide here. When I see a
definitive bottom, I add a lot more stocks to the portfolio using an S&P
500 ETF as I did back in October.

“Trade what you see; not what you think.” – The Old Fool,
Richard McCranie, trader extraordinaire.
“Is there really a man-made global warming crisis?... Dr.
John Clauser, a renowned physicist and Nobel Prize winner...vehemently opposes
the notion of a man-made climate crisis. In fact, he believes it's all a
deliberate hoax... founder of the Weather Channel, John Coleman. The now-late
veteran weatherman [said]... ‘Climate change is not happening; there is no
significant man-made global warming now, there hasn’t been any in the past, and
there is no reason to expect any in the future.’... Judith Curry...Georgia
Institute of Technology professor emerita...had scathing criticisms of her
colleagues in the science world. She has accused other scientists of
deceptively fueling the man-made climate emergency for ‘fame and fortune.’"
Story at...
Manufactured
Climate Consensus Deemed False By Climate Scientist - 'The Time For Debate Has
Ended' (msn.com)
My cmt: It is reasonably clear that the Earth has warmed
by 1 degree centigrade over the last 100 years.
The warming is due to rising CO2 levels in the atmosphere that are
manmade. (The physics are well understood from examining CO2 and temperatures
on other planets in our solar system.) Predictions suggest more hurricanes,
more tornados, faster sea level rise, high rainfall levels and many more catastrophes. The problem is that those climate changes
have not yet exceeded past variability of the data, thus the current climate
panic seems totally unjustified. Remember, the Intergovernmental Panel on
Climate Change (IPCC) defines climate in 30-year slices. Too often, the news
media reports on weather, not climate. Sadly, it has become so politicized that
we see absurd “climate fixes” like cancelling the Keystone Pipeline, that has
no effect on fossil fuel use, or eliminating gasoline powered cars when even
the DOT states it will have no effect on Global temperatures (in its current
rulemaking on gasoline mileage).
CONSUMER CONFIDENCE (Conference Board)
"Consumer confidence fell again in September 2023, marking two consecutive months of
decline," said Dana Peterson, Chief
Economist at The Conference Board... "Expectations for the next six months
tumbled back below the recession threshold of 80, reflecting less confidence
about future business conditions, job availability,
and incomes.” Press release at...
https://www.prnewswire.com/news-releases/us-consumer-confidence-fell-again-in-september-301938908.html
NEW HOME SALES (CNBC)
“Sales of newly built homes fell 8.7% in August from
July, to a seasonally adjusted annualized pace of 675,000 units, according to
the U.S. Census Bureau. That is the slowest pace since March. Sales were still
5.8% higher than August 2022.”
https://www.cnbc.com/2023/09/26/new-home-sales-fall-in-august.html
MARKET REPORT / ANALYSIS
-Tuesday the S&P 500 fell about 1.5% to 4274.
-VIX rose about 14% to 19.24.
-The yield on the 10-year Treasury rose to 4.553%, a
continuing worry for the stock market.
PULLBACK DATA:
-Drop from Top: 10.9%. 25.4% max (on a closing basis).
-Trading Days since Top: 434-days.
The S&P 500 is 1.9% ABOVE its 200-dMA and 4.3%
BELOW its 50-dMA.
*I won’t call the correction over until the S&P 500
makes a new-high; however, evidence suggests the bottom was in the 3600 area
and we called a buy on 4 October 2022.
MY TRADING POSITIONS:
XLK – Technology ETF (holding since the October 2022
lows).
XLY - Consumer Discretionary ETF. (Holding since the
October 2022 lows - I bought more XLY Monday, 8/21.)
I took profits and then reestablished positions as
follows:
SPY – I bought a large position in the S&P 500
Friday, 8/14, in my 401k (it has limited choices).
XLE – Added Tuesday, 8/22.
SSO – 2x S&P 500 ETF. Added 8/24.
CSCO – added 9/5.
TODAY’S COMMENT:
The markets have been falling all of August and September
with a small peak 31 August. Since the end of August, we could be in a “selling
stampede”; these tend to last 17 – 25 sessions, (the Index is at 17-days now) with
only 1.5- to three-day pauses/throwback rallies, before they exhaust themselves
on the downside. Once the markets get into one of these weekly downside skeins,
they rarely bottom on a Friday. They typically give participants over the
weekend to brood about their losses and then they show up the next Monday in
“sell mode” leading to Turning Tuesday. That’s why I mentioned earlier that we
might have to wait for Turning Tuesday to see a bottom. We didn’t have a turn today;
will we have to wait until next Tuesday for a bottom? Hard to say. Today could have been a bottom.
Today was a statistically significant down-day. That just
means that the price-volume move exceeded my statistical parameters. Statistics
show that a statistically-significant, down-day is followed by an up-day about
60% of the time. Bottoms almost always occur
on or near Statistically-significant, down-days, but not all
statistically-significant, down-days occur at bottoms. Today could be a
short-term bottom. There are 2 bottom indicators that are bullish and we still
see the VIX rate of change indicator in bullish mode. That is not as strong a
signal as we’d like to see, but Mr. Market rarely sends a completely clear
signal and he doesn’t read my blog either. Again, we note that short-term
market moves are difficult to call and involve a lot of luck to get it right.
Although it’s not in my system, the 5-dMA Hi/Lo Logic
Index turned bullish today due to very low new-highs over the last 5-days
suggesting at least a short-term bounce, now or soon.
The RSI and Bollinger Bands for the S&P 500 remains
oversold.
7-Day VIX ROC was 38 today: Per Tom McClellan, "...any
reading above around +20% is a pretty good sign of an oversold bottom for stock
prices, one that is worthy of a bounce...”
Overall though, indicators remain bearish and I haven’t yet
seen a bullish reversal in new-high/new-low data so there is no smoking gun
here. A drop to the 4200-4300 area is
still possible based on chart analysis and the Index 200-dMA, now at 4195.
The daily spread of 20 Indicators (Bulls minus Bears) remained
-6 (a positive number is bullish; negatives are bearish); the 10-day smoothed
sum that smooths the daily fluctuations declined from -51 to -56. (The
trend direction is more important than the actual number for the 10-day value.)
These numbers sometimes change after I post the blog based on data that comes
in late. Most of these 20 indicators are short-term so they tend to bounce
around a lot.
LONG-TERM INDICATOR: The Long Term NTSM indicator slipped
to SELL: VOLUME & VIX are bearish; PRICE & SENTIMENT are neutral.
I’m not selling now. I’d prefer to hang on since I
am still expecting a relatively shallow pullback from August highs.
(The important BUY in this indicator was on 21
October, 7-days after the bottom. For my NTSM overall signal, I suggested that
a short-term buying opportunity occurred on 27 September (based on improved
market internals on the retest), although without market follow-thru, I was
unwilling to call a buy; however, I did close shorts and increased stock
holdings. I issued a Buy-Signal on 4 October, 6-days before the final bottom,
based on stronger market action that confirmed the market internals signal. The
NTSM sell-signal was issued 21 December, 9 sessions before the high of this
recent bear market, based on the bearish “Friday Rundown” of indicators.)
It looks like the S&P 500 will dip to its 200-dMA. I
am still cautiously optimistic (perhaps I’m thinking too much) – I don’t think
the market has too much farther to go.
ETF - MOMENTUM ANALYSIS:
TODAY’S RANKING OF 15 ETFs
(Ranked Daily)
ETF ranking follows:
The top ranked ETF receives
100%. The rest are then ranked based on their momentum relative to the leading
ETF.
*For additional background on
the ETF ranking system see NTSM Page at…
http://navigatethestockmarket.blogspot.com/p/exchange-traded-funds-etf-ranking.html
DOW STOCKS - TODAY’S MOMENTUM RANKING
OF THE DOW 30 STOCKS (Ranked Daily)
DOW 30 momentum ranking
follows:
The top ranked Stock receives
100%. The rest are then ranked based on their momentum relative to the leading Stock.
For more details, see NTSM
Page at…
https://navigatethestockmarket.blogspot.com/p/a-system-for-trading-dow-30-stocks-my_8.html
TUESDAY MARKET INTERNALS (NYSE
DATA)
My basket of Market Internals remained SELL. (My basket of Market
Internals is a decent trend-following analysis of current market action, but
should not be used alone for short term trading. They are most useful when they
diverge from the Index.)
...My current invested
position is about 75% stocks, including stock mutual funds and ETFs. I’m
usually about 50% invested in stocks. I’m “over invested” now expecting new,
all-time highs this year. That burns all the cash. I have about 25% of the portfolio in bonds.
I trade about 15-20% of the
total portfolio using the momentum-based analysis I provide here. When I see a
definitive bottom, I add a lot more stocks to the portfolio using an S&P
500 ETF as I did back in October.
“Trade what you see; not what you think.” – The Old Fool,
Richard McCranie, trader extraordinaire.
“American government officials, working in concert with
big tech companies, defamed and suppressed me and my colleagues for criticizing
official pandemic policies – criticism that has been proven prescient...
...Lawyers in the Missouri v. Biden case took sworn
depositions from many federal officials involved in the censorship efforts,
including Anthony Fauci. During the hours-long deposition, Fauci showed a
striking inability to answer basic questions about his pandemic management,
replying “I don’t recall” over 170 times. Legal discovery unearthed email
exchanges between the government and social media companies showing an
administration willing to threaten the use of its regulatory power to harm
social media companies that did not comply with censorship demands...
...Censorship is the death of science and inevitably
leads to the death of people. America should be a bulwark against it, but it
was not during the pandemic. Though the tide is turning with the Missouri v. Biden case,
we must reform our scientific institutions so what happened during the pandemic
never happens again.” - Dr. Jay Bhattacharya, Professor of
Medicine at Stanford University and a research associate at the National Bureau
of Economics Research
American
Pandemic ‘Samizdat’ | RealClearPolitics
Thursday night the Biden administration lost yet another court battle in its
ongoing jihad against domestic fossil-fuels production...The administration was
trying to put severe restrictions on a lease sale involving millions of acres
in the Gulf of Mexico. Not only had the lease sale already been approved before
earlier Biden attempts to hobble it, but Congress, as part of the (misnamed)
Inflation Reduction Act of 2022, specifically directed that the planned sale be
reinstated... Biden last August lost another Louisiana-based case in which Biden
had tried to halt energy leases in 13 states. And in July of this year, the U.S. Supreme Court allowed the Mountain Valley
Pipeline in West Virginia and Virgina to continue despite Biden’s attempts to stop
it.” Story at...
Judge
is right to rebuke Biden's anti-oil obsession (msn.com)
Repeating an earlier post:
SHOCKING CANDOR ON FUEL STANDARDS (WSJ)
“For decades, bureaucrats in Washington have argued that
fuel-economy mandates pay for themselves... But unlike in previous rulemakings,
the costs are now so comically high that regulators can no longer pretend that
mandating greater fuel economy for passenger cars is good for society... But
the proposed rule says this White House’s not-so-secret password: climate
change. What about it? Without a hint of sarcasm, page 5-39 of the department’s
accompanying environmental assessment estimates that in 2060 the
proposal would reduce average global temperatures by 0.000%... Chinese
Communist Party officials must be reading our wonderful environmental
assessments for comic relief as they ramp up coal production.” - Michael
Buschbacher, partner at
the law firm Boyden Gray PLLC and served in the Justice Department’s
Environment Division (2020-21), and James Conde, counsel at Boyden Gray PLLC.
Commentary at...
https://www.wsj.com/articles/transportation-department-fuel-standards-car-ev-electric-vehicle-auto-industry-climate-change-388d6dd0
My cmt: If Global Temperatures will not be affected by
the above rule that essentially does away with gasoline powered vehicles, what
is the point?
If you would like to read and comment on this proposed
rule, go to...
https://www.regulations.gov/document/NHTSA-2023-0022-0004
The comments I read were all form letters from
Environmental Whackos who stated that “We urge NHTSA to finalize the strongest
rule possible...”
...This proposed rule remains open for comment. Comments are requested on or before October 16,
2023.
PULLBACK ACCELERATES (Heritage Capital)
“While the pieces are coming together nicely for a bottom
and Q4 rally as I have been writing about, it is never easy nor fun to live through.
Declines shakes investors’ faith and they don’t reengage until the best
opportunity has been exhausted. Next week I will be keenly watching for sectors
that are beginning to shape up for a rally. Right now, it’s hard to see.” –
Paul Schatz, President Heritage Capital.
https://investfortomorrow.com/blog/pullback-accelerates/
MARKET REPORT / ANALYSIS
-Monday the S&P 500 rose about 0.4% to 4337.
-VIX fell about 2% to 16.9.
-The yield on the 10-year Treasury rose to 4.537%, a
continuing worry for the stock market.
PULLBACK DATA:
-Drop from Top: 9.6%. 25.4% max (on a closing basis).
-Trading Days since Top: 433-days.
The S&P 500 is 3.4% ABOVE its 200-dMA and 3% BELOW
its 50-dMA.
*I won’t call the correction over until the S&P 500
makes a new-high; however, evidence suggests the bottom was in the 3600 area
and we called a buy on 4 October 2022.
MY TRADING POSITIONS:
XLK – Technology ETF (holding since the October 2022
lows).
XLY - Consumer Discretionary ETF. (Holding since the
October 2022 lows - I bought more XLY Monday, 8/21.)
I took profits and then reestablished positions as
follows:
SPY – I bought a large position in the S&P 500
Friday, 8/14, in my 401k (it has limited choices).
XLE – Added Tuesday, 8/22.
SSO – 2x S&P 500 ETF. Added 8/24.
CSCO – added 9/5.
TODAY’S COMMENT:
On 1 September, there were 22 Bull-indicators and Zero
Bear-indicators. As a result, I went
“all-in” again on the following Monday. The S&P 500 was 4497. The S&P
500 has dropped about 4% since then while indicators have shifted significantly
to the bear side. Friday, the summary of indicators on Friday was a bearish 15-bear
and 4-bull. I remain more than fully invested since several of the bull
indicators are calling for a bottom. As
I’ve noted frequently, calling short-term stock movement is a losing
proposition that is partly or even mostly luck, but I’ll hope for luck. Today’s
late-day, market action was bullish: Utilities were sold; Cyclical industrials
were bought; Consumer Discretionary stocks outpaced the S&P 500 – all are
bullish signs suggesting a possible end of market weakness. These are
just daily moves, but I’ll keep hoping for the luck factor.
I still haven’t seen a bullish reversal in
new-high/new-low data so there is no smoking gun here. A drop to the 4200-4300 area is still
possible based on chart analysis and the Index 200-dMA, now at 4193.
The daily spread of 20 Indicators (Bulls minus Bears) improved
from -7 to -6 (a positive number is bullish; negatives are bearish); the 10-day
smoothed sum that smooths the daily fluctuations declined from -44 to -51.
(The trend direction is more important than the actual number for the 10-day
value.) These numbers sometimes change after I post the blog based on data that
comes in late. Most of these 20 indicators are short-term so they tend to
bounce around a lot.
LONG-TERM INDICATOR: The Long Term NTSM indicator remains
HOLD: VOLUME is bearish; PRICE, SENTIMENT & VIX are neutral.
(The important BUY in this indicator was on 21
October, 7-days after the bottom. For my NTSM overall signal, I suggested that
a short-term buying opportunity occurred on 27 September (based on improved
market internals on the retest), although without market follow-thru, I was
unwilling to call a buy; however, I did close shorts and increased stock
holdings. I issued a Buy-Signal on 4 October, 6-days before the final bottom,
based on stronger market action that confirmed the market internals signal. The
NTSM sell-signal was issued 21 December, 9 sessions before the high of this
recent bear market, based on the bearish “Friday Rundown” of indicators.)
I am cautiously optimistic (perhaps I’m thinking too
much).
ETF - MOMENTUM ANALYSIS:
TODAY’S RANKING OF 15 ETFs
(Ranked Daily)
ETF ranking follows:
The top ranked ETF receives
100%. The rest are then ranked based on their momentum relative to the leading
ETF.
*For additional background on
the ETF ranking system see NTSM Page at…
http://navigatethestockmarket.blogspot.com/p/exchange-traded-funds-etf-ranking.html
DOW STOCKS - TODAY’S MOMENTUM RANKING
OF THE DOW 30 STOCKS (Ranked Daily)
DOW 30 momentum ranking
follows:
The top ranked Stock receives
100%. The rest are then ranked based on their momentum relative to the leading Stock.
For more details, see NTSM
Page at…
https://navigatethestockmarket.blogspot.com/p/a-system-for-trading-dow-30-stocks-my_8.html
MONDAY MARKET INTERNALS (NYSE
DATA)
My basket of Market Internals remained SELL. (My basket of Market
Internals is a decent trend-following analysis of current market action, but
should not be used alone for short term trading. They are most useful when they
diverge from the Index.)
...My current invested
position is about 75% stocks, including stock mutual funds and ETFs. I’m
usually about 50% invested in stocks. I’m “over invested” now expecting new,
all-time highs this year. That burns all the cash. I have about 25% of the portfolio in bonds.
I trade about 15-20% of the
total portfolio using the momentum-based analysis I provide here. When I see a
definitive bottom, I add a lot more stocks to the portfolio using an S&P
500 ETF as I did back in October.