Friday, December 29, 2017

Moving Average Stock Strategy … Stock Market Analysis … ETF Trading … Dow 30 Ranking

MOVING AVG STOCK STRATEGY
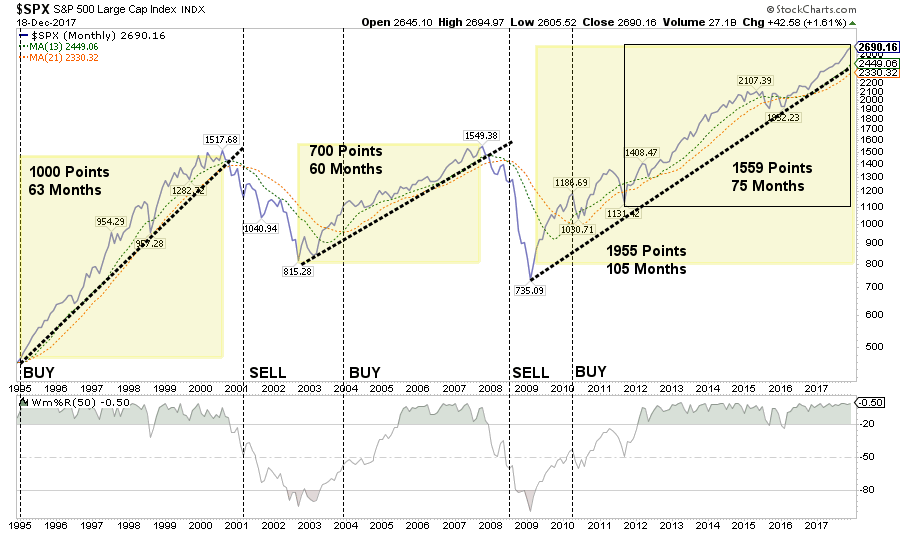
“At this point, before the close on the last day of the month, all three S&P 500 strategies are signaling "invested" — unchanged from last month's signal. All five Ivy Portfolio ETFs — Vanguard Total Stock Market ETF (VTI), Vanguard FTSE All-World ex-US ETF (VEU), and Vanguard REIT Index ETF (VNQ), and PowerShares DB Commodity Index (DBC) — are signaling "invested"…” Commentary at…
 
MARKET REPORT / ANALYSIS         
-Friday the S&P 500 was down about 0.5% to 2674. (Almost the entire drop happened in the last half hour of trading.)
-VIX was up about 8% to 11.04.
-The yield on the 10-year Treasury slipped to 2.411%.
 
My sum of 17 Indicators was unchanged at +4. On a 10-day basis, values moved up again. A “+” number means that most indicators are bullish. Volume picked up a little to about 75% of the norm for the month.
 
In the near term I am mildly bullish; longer term I am a bull, but I recommend caution with the Fed raising rates and shrinking its balance sheet. This party could end sometime in 2018; further, historically we are due for a correction in 2018 due to the Presidential election cycle.
 
TODAY’S RANKING OF  15 ETFs (Ranked Daily)
The top ranked ETF receives 100%. The rest are then ranked based on their momentum relative to the leading ETF.  While momentum isn’t stock performance per se, momentum is closely related to stock performance. For example, over the 4-months from Oct thru mid-February 2016, the number 1 ranked Financials (XLF) outperformed the S&P 500 by nearly 20%. Every Tech stock on the Dow 30 slipped today so it is no wonder that XLK has slipped to #4.
*For additional background on the ETF ranking system see NTSM Page at…
Energy (XLE) and Financials (XLF) were essentially tied at #1. The markets are due for some reversion so perhaps I’ll get a better buying opportunity later.  I’ll wait before adding any positions. (I hold XLK, DVY and SPY. DVY is a dividend play. SPY is a good core holding.)
 
Under my system in 2017, Technology (XLK) was ranked in the top 3 Momentum Plays for 52% of all trading days in the year (if I counted correctly.) XLK is up 35% year to date. Its weighted Average PE is 23.7
 
TODAY’S RANKING OF THE DOW 30 STOCKS (Ranked Daily)
The top ranked stock receives 100%. The rest are then ranked based on their momentum relative to the leading stock. 
 
Caterpillar was #1. (I hold Intel – I’m waiting for a better entry point before adding other positions.)
Avoid GE and Merck. Their 120-day moving averages are falling.
*I rank the Dow 30 similarly to the ETF ranking system. For more details, see NTSM Page at…
 
FRIDAY MARKET INTERNALS (NYSE DATA)
Market Internals remained Neutral on the market. (Market Internals are based on a package of internals and all must be positive to create a positive indication. This Neutral reading may be the result of low volume overall since low volume makes up-volume low even if up-volume outpaces down volume. On a percentage basis 58% of the volume has been up-volume over the last 10-days (same as yesterday) and that’s reasonably bullish.)
Market Internals are a decent trend-following analysis of current market action, but should not be used alone for short term trading. They are usually right, but they are often late.  They are most useful when they diverge from the Index.  In 2014, using these internals alone would have made a 9% return vs. 13% for the S&P 500 (in on Positive, out on Negative – no shorting). 
 
LONG TERM INDICATOR                                                        
Friday, Price indicator was positive; Sentiment was negative; Volume & VIX indicators were neutral.  With VIX recently below 10 for a couple of days in May, June, July, August, September, October, November and December, VIX may be prone to incorrect signals. Usually, a rising VIX is a bad market sign; now it may move up, but that might just signal normalization of VIX, i.e., VIX and the Index may both rise. As an indicator, VIX is out of the picture for a while. VIX below 10 last occurred about 4-months before the year 2007 crash and also several months before the 2001 crash.
MY INVESTED STOCK POSITION:
TSP (RETIREMENT ACCOUNT – GOV EMPLOYEES) ALLOCATION
I increased stock allocation to 50% stocks in the S&P 500 Index fund (C-Fund) 24 March 2017 in my long-term accounts, based on short-term indicators. The remainder is 50% G-Fund (Government securities). This is a conservative retiree allocation, but I consider it fully invested for my situation.

Thursday, December 28, 2017

Jobless Claims … Chicago PMI … Crude Inventories … Stock Market Analysis … ETF Trading … Dow 30 Ranking

JOBLESS CLAIMS (Reuters)
“The number of Americans filing for unemployment benefits was unchanged last week and the underlying trend remained consistent with a tightening labor market. U.S. workers filed 245,000 initial claims for state unemployment benefits during the week that ended Dec. 23…” Story at…
 
CHICAGO PMI (American Institute for Economic Research)
“The Chicago Business Barometer, a composite index based on a survey of purchasing mangers in the Chicago area, rose 3.7 points to 67.6 in December, the highest level since March 2011.” Story at…
 
CRUDE INVENTORIES (OilPrice.com)
“Amid a mixture of news pulling oil prices in opposite directions the Energy Information Administration reported another draw in U.S. crude oil inventories for the week to December 22. The EIA said inventories had gone down by 4.6 million barrels…” Story at…
The oil stocks are benefitting from higher crude prices. Chevron is up 22% since it bottomed in late July and is now not too far from its all-time high set in 2014.
 
MARKET REPORT / ANALYSIS         
-Thursday the S&P 500 was up about 0.2% to 2688.
-VIX was down about 3% to 10.18.
-The yield on the 10-year Treasury was UP slightly to 2.433%.
 
My sum of 17 Indicators increased from +3 to +4. On a 10-day basis, values crept up. A “+” number means that most indicators are bullish – perhaps too bullish. One indicator is signaling “sell”; one or two others are stretched. Volume remains low.
 
In the near term I am mildly bullish; longer term I am a bull, but I recommend caution with the Fed raising rates and shrinking its balance sheet. This party could end sometime in 2018.
 
TODAY’S RANKING OF  15 ETFs (Ranked Daily)
The top ranked ETF receives 100%. The rest are then ranked based on their momentum relative to the leading ETF.  While momentum isn’t stock performance per se, momentum is closely related to stock performance. For example, over the 4-months from Oct thru mid-February 2016, the number 1 ranked Financials (XLF) outperformed the S&P 500 by nearly 20%. Every Tech stock on the Dow 30 slipped today so it is no wonder that XLK has slipped to #4.
*For additional background on the ETF ranking system see NTSM Page at…
Energy (XLE) and Financials (XLF) were tied at #1. The markets are due for some reversion so perhaps I’ll get a better buying opportunity later.  I’ll wait before adding any positions. (I hold XLK, DVY and SPY. DVY is a dividend play. SPY is a good core holding.)
 
Under my system in 2017, Technology (XLK) was ranked in the top 3 Momentum Plays for 52% of all trading days in the year (if I counted correctly.) XLK is up 35% year to date. Its weighted Average PE is 23.7
 
TODAY’S RANKING OF THE DOW 30 STOCKS (Ranked Daily)
The top ranked stock receives 100%. The rest are then ranked based on their momentum relative to the leading stock. 
 
Caterpillar was #1. (I hold Intel – I’m waiting for a better entry point before adding other positions.)
Avoid GE and Merck. Their 120-day moving averages are falling.
*I rank the Dow 30 similarly to the ETF ranking system. For more details, see NTSM Page at…
 
THURSDAY MARKET INTERNALS (NYSE DATA)
Market Internals remained Neutral on the market. (Market Internals are based on a package of internals and all must be positive to create a positive indication. This Neutral reading may be the result of low volume overall since low volume makes up-volume low even if up-volume outpaces down volume. On a percentage basis 58% of the volume has been up-volume over the last 10-days and that’s reasonably bullish.)
Market Internals are a decent trend-following analysis of current market action, but should not be used alone for short term trading. They are usually right, but they are often late.  They are most useful when they diverge from the Index.  In 2014, using these internals alone would have made a 9% return vs. 13% for the S&P 500 (in on Positive, out on Negative – no shorting). 
 
LONG TERM INDICATOR                                                        
Thursday, Price indicator was positive; Sentiment was negative; Volume & VIX indicators were neutral. Price was too positive; it is so high that it is now a worrisome sign. I would not be surprised to see some selling in January.  With VIX recently below 10 for a couple of days in May, June, July, August, September, October, November and now December, VIX may be prone to incorrect signals. Usually, a rising VIX is a bad market sign; now it may move up, but that might just signal normalization of VIX, i.e., VIX and the Index may both rise. As an indicator, VIX is out of the picture for a while. VIX below 10 last occurred about 4-months before the year 2007 crash and also several months before the 2001 crash.
MY INVESTED STOCK POSITION:
TSP (RETIREMENT ACCOUNT – GOV EMPLOYEES) ALLOCATION
I increased stock allocation to 50% stocks in the S&P 500 Index fund (C-Fund) 24 March 2017 in my long-term accounts, based on short-term indicators. The remainder is 50% G-Fund (Government securities). This is a conservative retiree allocation, but I consider it fully invested for my situation.

Wednesday, December 27, 2017

Consumer Confidence … Texas Manufacturing Outlook … Sentiment … Stock Market Analysis … ETF Trading … Dow 30 Ranking

CONSUMER CONFIDENCE (Bloomberg)
“U.S. consumer confidence declined in December from a 17-year high as Americans became less upbeat about the outlook for the economy and job prospects, according to figures Wednesday from the New York-based Conference Board… Even with the latest cooling off, Americans remain upbeat -- this month was the strongest December since 2000.” Story at…
 
TEXAS MANUFACTURING OUTLOOK (Dallas Fed)
“Texas factory activity expanded strongly in December, according to business executives responding to the Texas Manufacturing Outlook Survey. The production index, a key measure of state manufacturing conditions, spiked 18 points to 32.8, reaching its highest level in more than 11 years…Perceptions of broader business conditions were markedly more positive in December. The general business activity index and the company outlook index posted double-digit increases, coming in at 29.7 and 31.5, respectively. Both represent highs last seen in 2006.” Press release at…
 
SENTIMENT. I measure Sentiment as %-Bulls (Bulls/{bulls+bears}) based on the amounts invested in Rydex/Guggenheim mutual funds. Sentiment is now a sell. On a standard deviation basis, current values have matched extremes seen during the dot.com crash. This isn’t by itself a great indicator since sentiment can remain elevated for some time, but it is a level that has preceded pullbacks of varying degrees – from small pullbacks of a couple % to major crashes.  We’d need to see more negative signs to take action, but it is a cautionary indication.
 
MARKET REPORT / ANALYSIS         
-Wednesday the S&P 500 was up about 0.1% to 2683.
-VIX was up about 2% to 10.47.
-The yield on the 10-year Treasury was UP slightly to 2.423%.
 
My sum of 17 Indicators slipped from +5 to +3. On a 10-day basis, values crept up. A “+” number means that most indicators are bullish – perhaps too bullish. There are a couple of topping indicators that are stretched.
 
No point is getting carried away with details.  Volume was about 60% of the norm for the last month on the NYSE. Overall volumes will remain low over the Holiday period so it is hard to put too much faith in the indicators.
 
In the near term I am mildly bullish; longer term I am a bull, but I recommend caution with the Fed raising rates and shrinking its balance sheet. This party could end sometime in 2018.
 
TODAY’S RANKING OF  15 ETFs (Ranked Daily)
The top ranked ETF receives 100%. The rest are then ranked based on their momentum relative to the leading ETF.  While momentum isn’t stock performance per se, momentum is closely related to stock performance. For example, over the 4-months from Oct thru mid-February 2016, the number 1 ranked Financials (XLF) outperformed the S&P 500 by nearly 20%. Every Tech stock on the Dow 30 slipped today so it is no wonder that XLK has slipped to #4.
*For additional background on the ETF ranking system see NTSM Page at…
Energy (XLE) was #1. The markets are due for some reversion so perhaps I’ll get a better buying opportunity later.  I’ll wait before adding any positions. (I hold XLK, DVY and SPY. DVY is a dividend play. SPY is a good core holding.)
 
Under my system in 2017, Technology (XLK) was ranked in the top 3 Momentum Plays for 52% of all trading days in the year (if I counted correctly.) XLK is up 35% year to date. Its weighted Average PE is 23.7
 
TODAY’S RANKING OF THE DOW 30 STOCKS (Ranked Daily)
The top ranked stock receives 100%. The rest are then ranked based on their momentum relative to the leading stock. 
 
Caterpillar was #1. (I hold Intel – I’m waiting for a better entry point before adding other positions.)
Avoid GE and Merck. Their 120-day moving averages are falling.
*I rank the Dow 30 similarly to the ETF ranking system. For more details, see NTSM Page at…
 
WEDNESDAY MARKET INTERNALS (NYSE DATA)
Market Internals remained Neutral on the market. (Market Internals are based on a package of internals and all must be positive to create a positive indication. This Neutral reading may be the result of low volume overall since low volume makes up-volume low even if up-volume outpaces down volume. On a percentage basis 56% of the volume has been up-volume over the last 10-days and that’s reasonably bullish. )
Market Internals are a decent trend-following analysis of current market action, but should not be used alone for short term trading. They are usually right, but they are often late.  They are most useful when they diverge from the Index.  In 2014, using these internals alone would have made a 9% return vs. 13% for the S&P 500 (in on Positive, out on Negative – no shorting). 
 
LONG TERM INDICATOR                                                        
Wednesday, Price indicator was positive; Sentiment was negative; Volume & VIX indicators were neutral. Price was too positive; it is so high that it is now a worrisome sign. I would not be surprised to see some selling in January.  With VIX recently below 10 for a couple of days in May, June, July, August, September, October, November and now December, VIX may be prone to incorrect signals. Usually, a rising VIX is a bad market sign; now it may move up, but that might just signal normalization of VIX, i.e., VIX and the Index may both rise. As an indicator, VIX is out of the picture for a while. VIX below 10 last occurred about 4-months before the year 2007 crash and also several months before the 2001 crash.
MY INVESTED STOCK POSITION:
TSP (RETIREMENT ACCOUNT – GOV EMPLOYEES) ALLOCATION
I increased stock allocation to 50% stocks in the S&P 500 Index fund (C-Fund) 24 March 2017 in my long-term accounts, based on short-term indicators. The remainder is 50% G-Fund (Government securities). This is a conservative retiree allocation, but I consider it fully invested for my situation.

Tuesday, December 26, 2017

Bubble Time … Stock Market Analysis … ETF Trading … Dow 30 Ranking

BUBBLE TIME (Real Investment Advice)
“Just as a reminder of previous market bubbles, here is what they looked like.” - Lance Roberts
Chart from…
 
MARKET REPORT / ANALYSIS         
-Tuesday the S&P 500 was down about 0.1% to 2681.
-VIX was up about 4% to 10.25.
-The yield on the 10-year Treasury was down slightly to 2.470%.
 
My sum of 17 Indicators remained at +6. As has been the case for a while, there was continued strong improvement on a 10-day basis. A “+” number means that most indicators are bullish – perhaps too bullish. There are a couple of topping indicators that are stretched and one or two that are Bearish.
 
No point is getting carried away with details.  Volume was about half the norm for the last month on the NYSE. Overall volumes will remain low over the Holiday period so it is hard to put too much faith in the indicators.
 
In the near term I am mildly bullish; longer term I am a bull, but I recommend caution with the Fed raising rates and shrinking its balance sheet. This party could end sometime in 2018.
 
TODAY’S RANKING OF  15 ETFs (Ranked Daily)
The top ranked ETF receives 100%. The rest are then ranked based on their momentum relative to the leading ETF.  While momentum isn’t stock performance per se, momentum is closely related to stock performance. For example, over the 4-months from Oct thru mid-February 2016, the number 1 ranked Financials (XLF) outperformed the S&P 500 by nearly 20%. Every Tech stock on the Dow 30 slipped today so it is no wonder that XLK has slipped to #4.
*For additional background on the ETF ranking system see NTSM Page at…
Financials (XLF) were #1. The markets are due for some reversion so perhaps I’ll get a better buying opportunity later.  I’ll wait before adding any positions. (I hold XLK, DVY and SPY. DVY is a dividend play. SPY is a good core holding.)
 
TODAY’S RANKING OF THE DOW 30 STOCKS (Ranked Daily)
The top ranked stock receives 100%. The rest are then ranked based on their momentum relative to the leading stock. 
 
Caterpillar was #1. (I hold Intel – I’m waiting for a better entry point before adding other positions.)
Avoid GE, IBM and Merck. Their 120-day moving averages are falling.
*I rank the Dow 30 similarly to the ETF ranking system. For more details, see NTSM Page at…
 
TUESDAY MARKET INTERNALS (NYSE DATA)
Market Internals remained Neutral on the market. (Market Internals are based on a package of internals and all must be positive to create a positive indication. This Neutral reading may be the result of low volume overall since low volume makes up-volume low even if up-volume outpaces down volume.)
Market Internals are a decent trend-following analysis of current market action, but should not be used alone for short term trading. They are usually right, but they are often late.  They are most useful when they diverge from the Index.  In 2014, using these internals alone would have made a 9% return vs. 13% for the S&P 500 (in on Positive, out on Negative – no shorting). 
 
LONG TERM INDICATOR                                                        
Tuesday, Price indicator was positive; Sentiment, Volume & VIX indicators were neutral. Price was too positive; it is so high that it is now a worrisome sign. I would not be surprised to see some selling in January.  With VIX recently below 10 for a couple of days in May, June, July, August, September, October, November and now December, VIX may be prone to incorrect signals. Usually, a rising VIX is a bad market sign; now it may move up, but that might just signal normalization of VIX, i.e., VIX and the Index may both rise. As an indicator, VIX is out of the picture for a while. VIX below 10 last occurred about 4-months before the year 2007 crash and also several months before the 2001 crash.
MY INVESTED STOCK POSITION:
TSP (RETIREMENT ACCOUNT – GOV EMPLOYEES) ALLOCATION
I increased stock allocation to 50% stocks in the S&P 500 Index fund (C-Fund) 24 March 2017 in my long-term accounts, based on short-term indicators. The remainder is 50% G-Fund (Government securities). This is a conservative retiree allocation, but I consider it fully invested for my situation.

Sunday, December 24, 2017

Consumer Spending … PCE Prices … Durable Goods Orders … New Home Sales … Michigan Consumer Confidence … Stock Market Analysis … ETF Trading … Dow 30 Ranking

We celebrated Christmas with the family Friday due to the usual conflicts, so I am just getting around to writing today.  Our Christmas was great – I hope you have a wonderful Holiday too.
 
CONSUMER SPENDING (Reuters)
“U.S. consumer spending accelerated in November and shipments of key capital goods orders increased for the 10th straight month, data showed on Friday, the latest signs of strong momentum in the economy as the year winds down. But the bullish growth picture was dimmed somewhat as the figures also showed household savings dropped last month to the lowest level in more than nine years. Low savings could hurt consumer spending, though economists are optimistic wage growth will pick up in the new year.” Story at…
 
PCE PRICES (Briefing.com)
“The PCE Price Index was up 0.2% (Briefing.com consensus +0.3%), leaving it up 1.8% year-over-year versus up 1.6% year-over-year in October… the PCE Price Index…is moving closer to the Fed's 2.0% longer-run target, which is supportive of the Fed's inclination to pursue an upward drift in the target range for the fed funds rate.” More at…
 
DURABLE GOODS (ABCnews)
“Orders for long-lasting manufactured goods rose last month by 1.3 percent, boosted by orders for both commercial and defense aircraft.” Story at…
 
NEW HOME SALES (USAtoday)
“Americans stepped up their purchases of new homes at the fastest pace in more than 25 years in November, with sales skyrocketing 17.5 percent amid robust demand and a continued shortage of existing homes on the market.” Story at…
 
MICHIGAN CONSUMER COONFIDENCE (Bloomberg)
“U.S. consumer sentiment fell by more than forecast in December on declining confidence among lower-income Americans, as a gauge of the outlook tumbled to a five-month low, a University of Michigan survey showed Friday… Even with the drop, the Michigan index remains elevated by historical standards…” Story at…
 
MARKET REPORT / ANALYSIS         
-Friday the S&P 500 was down about 0.1% to 2683.
-VIX was up about 3% to 9.90. (That is still an extreme low number that signals too much complacency.)
-The yield on the 10-year Treasury was little changed at 2.484%.
 
My sum of 17 Indicators improved slipped to +6 on the day from +8. There was, however, continued strong improvement on a 10-day basis. A “+” number means that most indicators are bullish – perhaps too bullish. There are a couple of topping indicators that are stretched and one or two that are Bearish.
 
We are due for a stall or pullback of some kind – we’ll see.
 
Breadth compared to the S&P 500 remained negative.  The % of stocks advancing on the NYSE does not support the Price change we have seen in the Index. This is a pretty good indicator, but is not perfect – none are.
 
My version of Smart Money (based on late day action) remains neutral so the Pros aren’t sure either.
 
In the near term I am mildly bullish; longer term I am a bull, but I recommend caution with the Fed raising rates and shrinking its balance sheet. This party could end sometime in 2018.
 
TODAY’S RANKING OF  15 ETFs (Ranked Daily)
The top ranked ETF receives 100%. The rest are then ranked based on their momentum relative to the leading ETF.  While momentum isn’t stock performance per se, momentum is closely related to stock performance. For example, over the 4-months from Oct thru mid-February 2016, the number 1 ranked Financials (XLF) outperformed the S&P 500 by nearly 20%.
*For additional background on the ETF ranking system see NTSM Page at…
Financials (XLF) moved into #1. The markets look a bit strained so perhaps I’ll get a better buying opportunity.  I’ll wait before adding any positions. (I hold XLK, DVY and SPY. DVY is a dividend play. SPY is a good core holding.)
 
TODAY’S RANKING OF THE DOW 30 STOCKS (Ranked Daily)
The top ranked stock receives 100%. The rest are then ranked based on their momentum relative to the leading stock. 
 
Caterpillar was #1. (I hold Intel – I’m waiting for a better entry point before adding other positions.)
Avoid GE, IBM and Merck. Their 120-day moving averages are falling.
*I rank the Dow 30 similarly to the ETF ranking system. For more details, see NTSM Page at…
 
FRIDAY MARKET INTERNALS (NYSE DATA)
Market Internals slipped to Neutral on the market. (Market Internals are based on a package of internals and all must be positive to create a positive indication. 
Market Internals are a decent trend-following analysis of current market action, but should not be used alone for short term trading. They are usually right, but they are often late.  They are most useful when they diverge from the Index.  In 2014, using these internals alone would have made a 9% return vs. 13% for the S&P 500 (in on Positive, out on Negative – no shorting). 
 
LONG TERM INDICATOR                                                        
Friday, Price indicator was positive; Sentiment, Volume & VIX indicators were neutral. Price was too positive; it is so high that it is now a worrisome sign. I would not be surprised to see some selling in January.  With VIX recently below 10 for a couple of days in May, June, July, August, September, October, November and now December, VIX may be prone to incorrect signals. Usually, a rising VIX is a bad market sign; now it may move up, but that might just signal normalization of VIX, i.e., VIX and the Index may both rise. As an indicator, VIX is out of the picture for a while. VIX below 10 last occurred about 4-months before the year 2007 crash and also several months before the 2001 crash.
MY INVESTED STOCK POSITION:
TSP (RETIREMENT ACCOUNT – GOV EMPLOYEES) ALLOCATION
I increased stock allocation to 50% stocks in the S&P 500 Index fund (C-Fund) 24 March 2017 in my long-term accounts, based on short-term indicators. The remainder is 50% G-Fund (Government securities). This is a conservative retiree allocation, but I consider it fully invested for my situation.

Thursday, December 21, 2017

GDP-Third Estimate … Philadelphia FED … Jobless Claims … Leading Economic Indicators … Sentiment … Stock Market Analysis … ETF Trading … Dow 30 Ranking

GDP (American Institute for Economic research)
“Third-Quarter Real GDP Rises 3.2 Percent; [Corporate] Profits Hit a Record
” Story at…
 
PHILADELPHIA FED (Morningstar)
“The Philadelphia Fed's Manufacturing Business Outlook Survey jumped to a reading of 26.2 in December from 22.7, beating the consensus forecast of a slight downtick to 21.8.” Story at…
 
JOBLESS CLAIMS (Reuters)
“The U.S. economy grew at its fastest pace in more than two years in the third quarter, powered by robust business spending, and is poised for what could be a modest lift next year from sweeping tax cuts passed by Congress this week…The fiscal stimulus is expected to come when the economy is at full employment, which raises the risk of it overheating.” Story at…
 
LEI (CNBC/Reuters)
“A key economic indicator met expectations in November, forecasting continued economic growth into 2018. Leading indicators rose by 0.4 percent...” Story at…
 
SENTIMENT. I measure Sentiment as %-Bulls (Bulls/{bulls+bears}) based on the amounts invested in Rydex/Guggenheim mutual funds. Sentiment is currently very high. It is not the first time though. On a standard deviation basis, values matched extremes seen during the dot.com crash back in May-June 2015 shortly before a 12% correction.
 
It is currently at 86%-bulls (as of Wednesday’s close). On a standard deviation basis. This again very nearly equal to levels seen during the dot.com crash. This isn’t by itself a great indicator since sentiment can remain elevated for some time, but it is a level that has preceded pullbacks of varying degrees – from small pullbacks of a couple % to major crashes.  We’d need to see more negative signs to take action, but it is a cautionary indication.
 
MARKET REPORT / ANALYSIS         
-Thursday the S&P 500 was up about 0.2% to 2685.
-VIX was down about 1% to 9.62.
-The yield on the 10-year Treasury was little changed at 2.485%.
 
My sum of 17 Indicators improved remained unchanged at +8 on the day. There was, however, continued strong improvement on a 10-day basis.
 
We are due for a stall or pullback of some kind – we’ll see. I’m not seeing too many negative indicators, but there are a number of indicators that are close to turning negative (RSI, Bollinger Bands, Index above the 200-dMA).
 
Breadth compared to the S&P 500 has now turned negative.  The % of stocks advancing on the NYSE does not support the Price change we have seen in the Index. This is a pretty good indicator, but is not perfect – none are.
 
Perhaps profit taking in the new-year will start some real selling. For now, there are few signs of an impending disaster (or even a slowdown in buying) so I’ll go with the flow.
 
My version of Smart Money (based on late day action) is neutral so the Pros aren’t sure either.
 
In the near term I am mildly bullish; longer term I am a bull, but I recommend caution with the Fed raising rates and shrinking its balance sheet. This party could end sometime in 2018.
 
TODAY’S RANKING OF  15 ETFs (Ranked Daily)
The top ranked ETF receives 100%. The rest are then ranked based on their momentum relative to the leading ETF.  While momentum isn’t stock performance per se, momentum is closely related to stock performance. For example, over the 4-months from Oct thru mid-February 2016, the number 1 ranked Financials (XLF) outperformed the S&P 500 by nearly 20%.
*For additional background on the ETF ranking system see NTSM Page at…
Technology (XLK) is tied with Financials (XLF) at #1. The markets look a bit strained so perhaps I’ll get a better buying opportunity.  I’ll wait before adding any positions. (I hold XLK, DVY and SPY. DVY is a dividend play. SPY is a good core holding.)
 
TODAY’S RANKING OF THE DOW 30 STOCKS (Ranked Daily)
The top ranked stock receives 100%. The rest are then ranked based on their momentum relative to the leading stock. 
 
Caterpillar and Intel are #1. (I hold Intel – I’m waiting for a better entry point before adding other positions.)
Avoid GE and Merck. Their 120-day moving averages are falling.
*I rank the Dow 30 similarly to the ETF ranking system. For more details, see NTSM Page at…
 
THURSDAY MARKET INTERNALS (NYSE DATA)
Market Internals remained Positive on the market. (Market Internals are based on a package of internals and all must be positive to create a positive indication. 
Market Internals are a decent trend-following analysis of current market action, but should not be used alone for short term trading. They are usually right, but they are often late.  They are most useful when they diverge from the Index.  In 2014, using these internals alone would have made a 9% return vs. 13% for the S&P 500 (in on Positive, out on Negative – no shorting). 
 
LONG TERM INDICATOR                                                        
Thursday, Price indicator was positive; Sentiment, Volume & VIX indicators were neutral. Price was too positive; it is so high that it is now a worrisome sign. With VIX recently below 10 for a couple of days in May, June, July, August, September, October, November and now December, VIX may be prone to incorrect signals. Usually, a rising VIX is a bad market sign; now it may move up, but that might just signal normalization of VIX, i.e., VIX and the Index may both rise. As an indicator, VIX is out of the picture for a while. VIX below 10 last occurred about 4-months before the year 2007 crash and also several months before the 2001 crash.
MY INVESTED STOCK POSITION:
TSP (RETIREMENT ACCOUNT – GOV EMPLOYEES) ALLOCATION
I increased stock allocation to 50% stocks in the S&P 500 Index fund (C-Fund) 24 March 2017 in my long-term accounts, based on short-term indicators. The remainder is 50% G-Fund (Government securities). This is a conservative retiree allocation, but I consider it fully invested for my situation.