GDP-Adv (NYTimes)
“U.S. Economy Cooled as
G.D.P. Grew at 2.6% Rate in Fourth Quarter…’I think this is a slowing,’
said Lewis Alexander, chief United States economist for Nomura. ‘I don’t
think this is ‘we’re falling into an abyss.’” Story
at…
JOBLESS CLAIMS (MarketWatch)
“The number of people who applied for unemployment
benefits in late February rose modestly but remained near the lowest level in
decades, suggesting the labor market is still rock solid. Jobless claims, a
rough measure of layoffs, rose by 8,000 to 225,000 in the seven days ended Feb.
23…” Story at…
CHICAGO PMI (MarketWatch)
"The Chicago PMI surged 8 points to a reading of 64.7 in
February, MNI Indicators said Thursday…’The sharp pick-up in the barometer to a
level not seen in over a year, underpinned by the growth in demand and
production, showcases a healthy image of the U.S. economy,’ said Shaily Mittal,
senior economist at MNI Indicators.” Story at…
REGIONAL MANUFACTURING (Advisor Perspectives)
“Five out of the twelve Federal Reserve Regional Districts currently
publish monthly data on regional manufacturing: Dallas, Kansas City, New York,
Richmond, and Philadelphia…Manufacturing makes up 12% of the country's GDP…Here
is [a] chart including the average of the five.”

Additional charts and commentary at…
The composite ISM chart is also trending down, but not as
steeply as the one above.
MARKET REPORT / ANALYSIS
-Thursday the S&P 500 dipped about 0.3% to 2784.
-VIX rose about 0.5% to 14.78. (The Options Boys don’t
seem worried.)
-The yield on the 10-year Treasury rose to 2.717% (The
Bond Ghouls weren’t worried either.)
We noticed momentum slipping over the past several sessions.
After a rally that lasted 42 sessions
and regained nearly 19% on the S&P 500, it is not surprising. We have now seen
3 down-days in a row. Today, the MACD (Moving Average Convergence/Divergence) made
it official as the MACD line gave a bearish signal on a crossover with its
signal line. MACD is confirming the downtrend in price. MACD is a popular indicator and, since it is
followed by many traders (professional and amateur), we are probably headed
down. There are other indicators that are also looking more bearish.
BEAR SIGNS
-Up-volume is falling and has been since mid-January.
-Breadth has been falling since mid-January, too, and it
remains overbought. Over the last 10-days 56% of stocks have advanced on the
NYSE. That number was 62% just 3 days
ago.
-My Money Trend indicator is falling. This indicator
peaked in mid-January.
-Bollinger Bands were close to overbought 2-weeks ago,
but never quite got there.
-New-high/new-low data is headed down.
-RSI was nearly overbought today. Usually RSI isn’t overbought on a down day,
but since the size of up-moves have been larger than down-moves over the last
3-weeks we got a signal that is bearish and nearly overbought.
-Smart Money (based on late-day action) is quite bearish.
It turned down 2-weeks ago.
-Even the cyclical industrial stocks (XLI-ETF) that had
been outperforming the S&P 500 since the December bottom are now slipping
relative to the S&P 500. XLI, and
all cyclicals for that matter, underperform the S&P 500 if investors are
worried.
BULL SIGNS
-VIX is falling nicely on a smoothed basis, however, if
this dip in the S&P 500 persists that will change quickly.
-Over the last 2-weeks, up moves have been larger than
down moves.
Overall, my daily sum of 20 Indicators slipped from +2 to
-1 (a positive number is bullish; negatives are bearish) while the 10-day
smoothed version that negates the daily fluctuations dropped from +77 to +67. This
is a now a mildly bearish indication.
There aren’t many bull signs in the short-term signals. The
market will likely head down; a guess might be roughly a 10%-drop since that
would retrace half the recent rally. I think it will drop more.
Levels of resistance on the way up are now points of support.
The Index is 1.3% above the 200-dMA and
5.6% above the 50-dMA. Some of the Elliott Wave folks are suggesting a drop
well below the December low. As I have
repeated too many times:
There hasn’t been a 15%+ correction in the last 50-years
that didn’t retest the prior lows.
A full retest of the Christmas Eve low seems unlikely, but it could still happen. Given
the length of time since the December low (more than 2 months) a drop to within
a couple of percent of the prior low would be close enough to be considered a
retest of the low and that’s a decent probability.
Only a retest at or near the 2351 level, or a climb back
above the old highs, will tell us whether 2351 was THE bottom. Last week’s
financial data (LEI, Philly FED, Durable Orders and Jobless Claims) were weak
and one wonders whether the markets can retake old highs any time soon – it
looks doubtful to me.
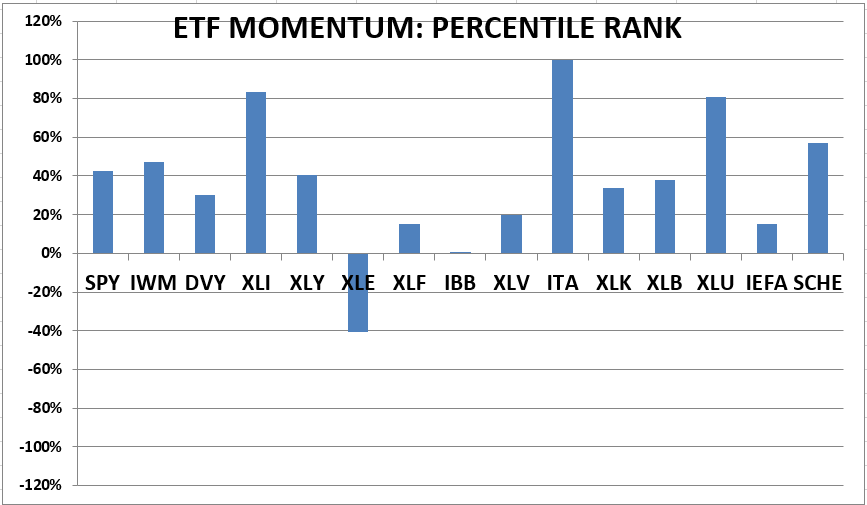
MOMENTUM ANALYSIS:
TODAY’S RANKING OF
15 ETFs (Ranked Daily)

The top ranked ETF receives 100%. The rest are then
ranked based on their momentum relative to the leading ETF. While momentum isn’t stock performance per
se, momentum is closely related to stock performance. For example, over the
4-months from Oct thru mid-February 2016, the number 1 ranked Financials (XLF)
outperformed the S&P 500 by nearly 20%. In 2017 Technology (XLK) was ranked
in the top 3 Momentum Plays for 52% of all trading days in 2017 (if I counted
correctly.) XLK was up 35% on the year while the S&P 500 was up 18%.
*For additional background on the ETF ranking system see
NTSM Page at…
TODAY’S RANKING OF THE DOW 30 STOCKS (Ranked Daily)

The top ranked stock receives 100%. The rest are then
ranked based on their momentum relative to the leading stock.
*I rank the Dow 30 similarly to the ETF ranking system. For
more details, see NTSM Page at…
THURSDAY MARKET INTERNALS (NYSE DATA)
Market Internals
remained NEUTRAL on the market.
Market Internals are a decent trend-following analysis of
current market action but should not be used alone for short term trading. They
are usually right, but they are often late.
They are most useful when they diverge from the Index. In 2014, using these internals alone would
have made a 9% return vs. 13% for the S&P 500 (in on Positive, out on
Negative – no shorting).
My current stock allocation is about 30% invested in
stocks on as of 9 January 2019. For me, fully invested is a balanced 50% stock
portfolio so this is a very conservative position.
INTERMEDIATE / LONG-TERM INDICATOR
Thursday, the VIX
and PRICE indicators were positive. The VOLUME and SENTIMENT indicators were
neutral. Overall this is a POSITIVE/BULLISH indication. I remain defensive,
expecting some sort of pullback.