“Trade what you see; not what you think.” – The Old Fool, Richard McCranie, trader extraordinaire.
“U.S. households’ spending rose more rapidly last month as annual inflation hit a new four-decade high, outpacing income growth. Consumers boosted their seasonally adjusted spending by 1.1% in June... Personal income rose by 0.6% last month, the same as the prior month. After taxes and adjusting for inflation, incomes fell by 0.3%.” Story at...
https://www.wsj.com/articles/inflation-consumer-spending-personal-income-june-2022-11659059583
“Another key measure of inflation set a fresh 40-year high in June, a month marked by record-high gas prices. The Personal Consumption Expenditures price index, which measures the change in the prices of goods and services purchased by consumers, rose by 6.8% in June as compared to the same period last year...core PCE – the inflation index closely watched by the Federal Reserve – increased by 4.8% from one year ago, up slightly from May but down from a high of 5.3% in February.” Story at...
https://www.cnn.com/2022/07/29/economy/pce-inflation-june-fed/index.html
“A broad measure of workers' compensation increased modestly more quickly than anticipated over the three months to June. According to the US Department of Labor, the Employment Cost Index advanced at a quarter-on-quarter clip of 1.3% during the second quarter.” Story at
https://www.sharecast.com/news/international-economic/us-q2-employment-cost-index-rises-a-bit-more-quickly-than-anticipated--10260141.html
“The Chicago Business Barometer, also known as the Chicago PMI, fell to 52.1in July from 56 in the prior month. It is the lowest reading since August 2020. Economists polled by the Econoday forecast a steady 56 reading.” Story at...
https://www.marketwatch.com/story/chicago-pmi-continues-to-soften-in-july-falls-to-lowest-level-in-almost-two-years-11659102951
“Consumer sentiment was essentially unchanged from June, when it had reached an all-time low for the survey, according to the University of Michigan Surveys of Consumers. Most components of the index were little changed, though buying conditions for durables adjusted upwards, primarily due to perceptions of easing supply constraints. Still, buying conditions for durables remained 28% lower than July 2021, according to U-M economist Joanne Hsu, director of the surveys.” Story at...
https://news.umich.edu/consumers-adjust-to-inflation-as-labor-market-expectations-worsen/
-Friday the S&P 500 rose about 1.4% to 4130.
-VIX dipped about 4% to 21.33.
-The yield on the 10-year Treasury slipped to 2.651%.
-Drop from Top: 13.9% as of today. 23.6% max.
-Trading Days since Top: 143-days.
The S&P 500 is 5% Below its 200-dMA & closed 5.3% Above its 50-dMA. It also closed above its 100-dMA Friday.
SH, short the S&P 500 ETF. I added a position in SSO today, cancelling my short (without selling it) and adding to the stock side of the portfolio with a short-term holding.
On Fridays, I summarize a number of indicators to get a weekly feel for trend. Not much change from last week – indicators remain to the Bull side (6-bear and 18-bull). These indicators tend to be both long-term and short-term, so they are different than the 20 that I report on daily. Details follow:
-The 10-dMA % of issues advancing on the NYSE (Breadth) is above 50%.
-The 50-dMA percentage of issues advancing on the NYSE (Breadth) is above 50.
-The 100-dMA percentage of issues advancing on the NYSE (Breadth) is above 50%
-Sentiment.
-MACD of the percentage of issues advancing on the NYSE (breadth) made a bullish crossover 24 June.
-MACD of S&P 500 price made a bullish crossover 24 June.
-Short-term new-high/new-low data.
-My Money Trend indicator.
-VIX.
-The size of up-moves has been larger than the size of down-moves over the last month.
-The longer-term, 50-dEMA, Fosback Hi-Low Logic Index is Bullish.
-McClellan Oscillator is positive.
-The graph of the 100-day Count (the 100-day sum of up-days) is headed up.
-The 5-10-20 Timer System is BUY; the 5-dEMA and 10-dEMA are both ABOVE the 20-dEMA.
-The smoothed advancing volume on the NYSE is rising.
-Cyclical Industrials (XLI-ETF) are out-performing the S&P 500. ?????
-67% of the 15-ETFs that I track have been up over the last 10-days – this is starting to look overdone.
- S&P 500 is outperforming the Utilities (XLU), but not by much.
-The short-term, 5-day & 10-day, Fosback Hi-Low Logic Indexes.
-The 50-dMA percentage of issues advancing on the NYSE (Breadth) popped above 50% ending its streak of consecutive days. (3 days in a row is my “correction-now” signal)
-There was a Follow-thru Day 27 July that canceled all Distribution Days in the last 5 weeks.
-There have been 3 Statistically-Significant day (big moves in price-volume) in the last 15-days.
-Issues advancing on the NYSE (Breadth) compared to the S&P 500.
-The S&P 500 is 5% below its 200-dMA. (Bull indicator is 12% below the 200-day, although this is based on “normal” pullbacks.)
-RSI
-There was an Inverse Zweig Breadth Collapse (negative Breadth Thrust) 21 June. That’s a rare, very-bearish sign, but it was 4-weeks ago.
-The 52-week, New-high/new-low ratio improved by 0.7 standard deviations on 15 July – too small to send a signal.
-There was a Hindenburg Omen signal 8 April – it was canceled when the McClellan Oscillator turned bullish.
-The Calm-before-the-Storm/Panic Indicator.
-1 July was a Bullish Outside Reversal Day – expired.
-2.8% of all issues traded on the NYSE made new, 52-week highs when the S&P 500 made a new all-time-high, 3 January. (There is no bullish signal for this indicator.) This indicated that the advance was too narrow and a correction was likely to be >10%. – It proved correct, but is now Expired
-There have been 12 up-days over the last 20 sessions –neutral.
-There have been 7 up-days over the last 10 sessions – neutral.
-There were three 90% Down-volume days 9-16June. There was a high up-volume day 19 July, but it was too long after the down-days to signal a reversal.
-Long-term new-high/new-low data.
-Buying Pressure minus Selling Pressure ticked down again today.
-Bollinger Bands are bearish.
-Slope of the 40-dMA of New-highs is down. This is one of my favorite trend indicators.
-The Smart Money (late-day action) is turning down.
-Overbought/Oversold Index (Advance/Decline Ratio).

BEST ETFs - MOMENTUM ANALYSIS:
TODAY’S RANKING OF 15 ETFs (Ranked Daily)

*For additional background on the ETF ranking system see NTSM Page at…
http://navigatethestockmarket.blogspot.com/p/exchange-traded-funds-etf-ranking.html
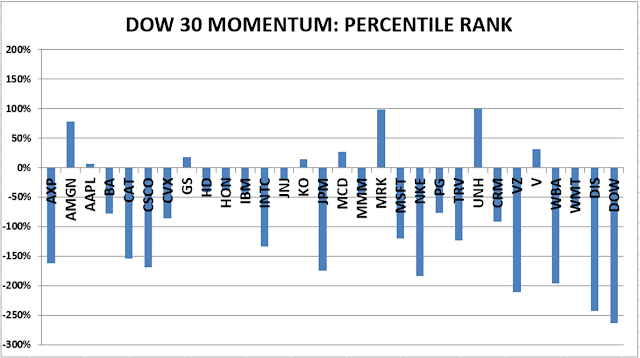
Here’s the revised DOW 30 and its momentum analysis. The top ranked stock receives 100%. The rest are then ranked based on their momentum relative to the leading stock.

https://navigatethestockmarket.blogspot.com/p/a-system-for-trading-dow-30-stocks-my_8.html