Wednesday, July 31, 2019

FOMC Rate Decision … Chicago PMI … Crude Oil Inventories … Stock Market Analysis… ETF Trading … Dow 30 Ranking


“Trade what you see; not what you think.” – The Old Fool, Richard McCranie, trader extraordinaire.
 
FOMC RATE DECISION (CNBC)
“The policymaking Federal Open Market Committee drops the target range for its overnight lending rate to 2% to 2.25%, or 25 basis points from the previous level.
The Fed cites “implications of global developments for the economic outlook as well as muted inflation pressures” in its first rate cut since December 2008.” Story at…
My cmts: Markets didn’t like the news as the stock market dropped around 2pm and fell sharply around 2:30, presumably during the FED news conference. It is a bit surprising since a 025% cut was widely expected. This is probably algorithm trading and may not mean much.
 
CHICAGO PMI (MarketWatch)
“A measure of business conditions in the Chicago region dropped further into contraction territory in July. The Chicago PMI business barometer decreased to 44.4 in July from 49.7 in June…” Story at…
My cmt: Any number below 50 indicates contraction so this is not good news. The markets fell after 10am (when the news came out), but it is never a sure thing that the drop was due to the PMI number.
 
CRUDE OIL INVENTORIES (OilPrice.com)
“A day after yet another bullish oil inventory estimate from the American Petroleum Institute, the Energy Information Administration reported another solid decline in inventories, which added fuel to the price rally.”  Story at…
My cmt: One would think that rising oil prices would be bad for the economy and bad for stocks.  It is generally bad for the economy, but there are so many oil services stocks that it is often good for the stock market indices.
 
MARKET REPORT / ANALYSIS         
-Wednesday the S&P 500 dipped about 1.1% to 2980.
-VIX rose about 16% to 16.12.
-The yield on the 10-year Treasury slipped to 2.011%.
 
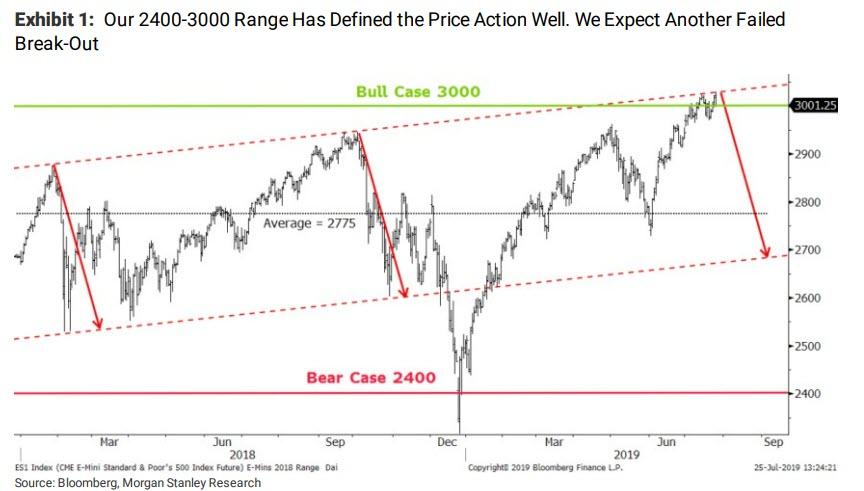
Here’s another chart with the same point as yesterday. Can the S&P 500 break convincingly above its trend line defined by the highs going back to 2018? The odd thing is, I see so many charts that depend on the scale chosen for the x and y axes. Yesterday’s chart showed the S&P 500 above the trend.  This one shows it on the trend even though the writer uses 3000 as the make or break level. We’ve had 6 closes in a row above 3000 so one would think the S&P 500 has claimed the higher ground and one rule confirms it. Another rule of thumb says we need to break above a trend line by 3% to set a new trend.  The 3% rule says we need to get above 3090.
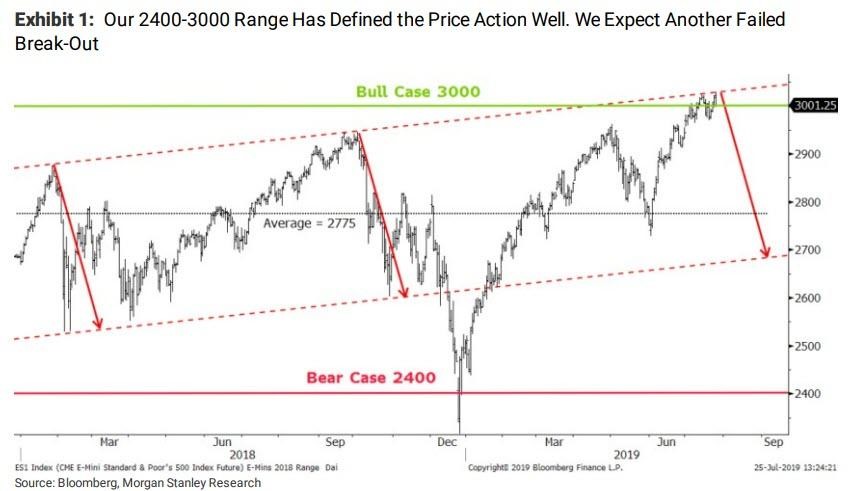
Chart from…
 
Today’s results weren’t too encouraging; the Index failed again to hold the 3000 level, even after a number of closes higher. Not a good sign, but the news wasn't all bad.
 
Today, the drop in the S&P 500 cleared one of our negative signs: The S&P 500 was too far ahead of its 200-day average w/sentiment, but not now.  This is a top-indicator, but it may be too sensitive since the 200-dMA has been nearly flat due to the prior correction. In addition, the Internals I track suprisingly turned positive.
 
Today was a statistically-significant down-day. That just means that the price-volume move exceeded my statistical parameters. Statistics show that a statistically significant down-day is followed by an up-day about 60% of the time.
 
Overall, my daily sum of 20 Indicators slipped from zero to -1 (a positive number is bullish; negatives are bearish) while the 10-day smoothed version that negates the daily fluctuations improved from -4 to -3. (These numbers sometimes change after I post the blog based on data that comes in late.) Most of these indicators are short-term.
 
Are we starting a correction without confirmed top indicators?  We don’t know; we’ll just have to watch the market a bit more. Top indicators improved from -3 to -2.
 
TOP / BOTTOM INDICATOR SCALE OF 1 TO 10 (Zero is a neutral reading.)
Today’s Reading: -2      
Most Recent Day with a value other than Zero: -2 on 30 July (the S&P 500 is stretched relative to breadth; the Money Trend Indicator is stretched relative to the S&P 500.)
(1) +10 Max Bullish / -10 Max Bearish)
(2) -4 or below is a Sell sign. +4 or better is a Buy Sign.
 
MOMENTUM ANALYSIS:
TODAY’S RANKING OF  15 ETFs (Ranked Daily)
 
The top ranked ETF receives 100%. The rest are then ranked based on their momentum relative to the leading ETF.  While momentum isn’t stock performance per se, momentum is closely related to stock performance. For example, over the 4-months from Oct thru mid-February 2016, the number 1 ranked Financials (XLF) outperformed the S&P 500 by nearly 20%. In 2017 Technology (XLK) was ranked in the top 3 Momentum Plays for 52% of all trading days in 2017 (if I counted correctly.) XLK was up 35% on the year while the S&P 500 was up 18%.
*For additional background on the ETF ranking system see NTSM Page at…
 
TODAY’S RANKING OF THE DOW 30 STOCKS (Ranked Daily)
The top ranked stock receives 100%. The rest are then ranked based on their momentum relative to the leading stock.
*I rank the Dow 30 similarly to the ETF ranking system. For more details, see NTSM Page at…
 
WEDNESDAY MARKET INTERNALS (NYSE DATA)
Market Internals improved to POSITIVE on the market.
Market Internals are a decent trend-following analysis of current market action but should not be used alone for short term trading. They are usually right, but they are often late.  They are most useful when they diverge from the Index.  In 2014, using these internals alone would have made a 9% return vs. 13% for the S&P 500 (in on Positive, out on Negative – no shorting).
 
Using the Short-term indicator in 2018 in SPY would have made a 5% gain instead of a 6% loss for buy-and-hold. The methodology was Buy on a POSITIVE indication and Sell on a NEGATIVE indication and stay out until the next POSITIVE indication. The back-test included 13-buys and 13-sells, or a trade every 2-weeks on average.  
 
My current stock allocation is about 55% invested in stocks as of 4 June 2019. This is based on the improved indicators 3 June and my recommendation to increase stock holdings if we saw strong buying on 4 June. As a retiree, I am conservatively positioned with a balanced portfolio.  You may be comfortable with a higher % invested in stocks – that’s OK.
 
INTERMEDIATE / LONG-TERM INDICATOR
Wednesday, the PRICE indicator was positive; the SENTIMENT, VIX and VOLUME indicators were neutral. Overall, the Long-Term Indicator is HOLD.

Tuesday, July 30, 2019

Personal Spending … PCE Price Index … Consumer Confidence … Stock Market Analysis… ETF Trading … Dow 30 Ranking

“Trade what you see; not what you think.” – The Old Fool, Richard McCranie, trader extraordinaire.
 
PERSONAL SPENDING / PCE PRICE INDEX  (Reuters)
“U.S. consumer spending and prices rose moderately in June, pointing to slower economic growth and benign inflation that could see the Federal Reserve cutting interest rates on Wednesday for the first time in a decade.” Story at…
 
CONSUMER CONFIDENCE (PRNewsWire)
“The Conference Board Consumer Confidence Index® rebounded in July, following a decrease in June. The Index now stands at 135.7 (1985=100), up from 124.3 in June…"After a sharp decline in June, driven by an escalation in trade and tariff tensions, Consumer Confidence rebounded in July to its highest level this year," said Lynn Franco, Senior Director of Economic Indicators at The Conference Board. "Consumers are once again optimistic about current and prospective business and labor market conditions. In addition, their expectations regarding their financial outlook also improved. These high levels of confidence should continue to support robust spending in the near-term despite slower growth in GDP." Press release at…
 
MARKET REPORT / ANALYSIS         
-Tuesday the S&P 500 dipped about 0.3% to 3013.
-VIX rose about 9% to 13.94.
-The yield on the 10-year Treasury slipped to 2.062%.
 
Here’s an issue for the markets. Can the S&P 500 break convincingly above its trend line defined by the highs going back to 2018? I ‘don’t have an answer.  We expect a pullback of some kind, but it seems to be taking its time getting here.
 

Today there weren’t many changes in the indicators. See yesterday’s blog for a run down of many of the indicators.
 
Overall, my daily sum of 20 Indicators slipped from +2 to zero (a positive number is bullish; negatives are bearish) while the 10-day smoothed version that negates the daily fluctuations improved from -6 to -4. (These numbers sometimes change after I post the blog based on data that comes in late.) Most of these indicators are short-term.
 
How long do I hang on before cutting some stock holdings? Bollinger bands and RSI will probably signal the top if other indicators remain negative.
 
TOP / BOTTOM INDICATOR SCALE OF 1 TO 10 (Zero is a neutral reading.)
Today’s Reading: -3      
Most Recent Day with a value other than Zero: -3 on 30 July (The S&P 500 was too far ahead of its 200-day average w/sentiment, top-indicator; the S&P 500 is stretched relative to breadth; the Money Trend Indicator is stretched relative to the S&P 500.)
(1) +10 Max Bullish / -10 Max Bearish)
(2) -4 or below is a Sell sign. +4 or better is a Buy Sign.
 
MOMENTUM ANALYSIS:
TODAY’S RANKING OF  15 ETFs (Ranked Daily)
 
The top ranked ETF receives 100%. The rest are then ranked based on their momentum relative to the leading ETF.  While momentum isn’t stock performance per se, momentum is closely related to stock performance. For example, over the 4-months from Oct thru mid-February 2016, the number 1 ranked Financials (XLF) outperformed the S&P 500 by nearly 20%. In 2017 Technology (XLK) was ranked in the top 3 Momentum Plays for 52% of all trading days in 2017 (if I counted correctly.) XLK was up 35% on the year while the S&P 500 was up 18%.
*For additional background on the ETF ranking system see NTSM Page at…
 
TODAY’S RANKING OF THE DOW 30 STOCKS (Ranked Daily)
The top ranked stock receives 100%. The rest are then ranked based on their momentum relative to the leading stock.
*I rank the Dow 30 similarly to the ETF ranking system. For more details, see NTSM Page at…
 
TUESDAY MARKET INTERNALS (NYSE DATA)
Market Internals remained NEUTRAL on the market.
Market Internals are a decent trend-following analysis of current market action but should not be used alone for short term trading. They are usually right, but they are often late.  They are most useful when they diverge from the Index.  In 2014, using these internals alone would have made a 9% return vs. 13% for the S&P 500 (in on Positive, out on Negative – no shorting).
 
Using the Short-term indicator in 2018 in SPY would have made a 5% gain instead of a 6% loss for buy-and-hold. The methodology was Buy on a POSITIVE indication and Sell on a NEGATIVE indication and stay out until the next POSITIVE indication. The back-test included 13-buys and 13-sells, or a trade every 2-weeks on average.  
 
My current stock allocation is about 55% invested in stocks as of 4 June 2019. This is based on the improved indicators 3 June and my recommendation to increase stock holdings if we saw strong buying on 4 June. As a retiree, I am conservatively positioned with a balanced portfolio.  You may be comfortable with a higher % invested in stocks – that’s OK.
 
INTERMEDIATE / LONG-TERM INDICATOR
Tuesday, the PRICE and VIX indicators were positive; the SENTIMENT and VOLUME indicators were neutral. Overall, the Long-Term Indicator is BUY. The indicator is designed to signal Buy after a bottom.  At this point, it just means that conditions have been bullish; I think they may be too bullish and a decline is likely to be coming.

Monday, July 29, 2019

Earnings … Low GDP is a Head Fake … Little Sign of Recession … Stock Market Analysis… Off Topic - Border Wall … ETF Trading … Dow 30 Ranking

“Trade what you see; not what you think.” – The Old Fool, Richard McCranie, trader extraordinaire.
 
 
EARNINGS (Factset)
“To date, 44% of the companies in the S&P 500 have reported actual results for Q2 2019. In terms of earnings, the percentage of companies reporting actual EPS above estimates (77%) is above the five-year average. In aggregate, companies are reporting earnings that are 5.4% above the estimates, which is also above the five-year average. In terms of sales, the percentage of companies (61%) reporting actual sales above estimates is above the five-year average. In aggregate, companies are reporting sales that are 1.2% above estimates, which is also above the five-year average.” Report available from…
 
THE SOFT GDP REPORT IS A HEAD FAKE (MarketWatch)
“Contrary to what you may read elsewhere, the U.S. economy did not slump in the second quarter of the year. True, real gross domestic product slowed to a 2.1% annual pace from 3.1% in the first quarter, but as I’ve reported before, GDP is a poor measure of the economy’s health over the short or medium term. It’s distorted by accounting entries that can sometimes make good news seem bad…Final sales to domestic purchasers — the best measure of demand within the United States — rose at a 3.5% annual pace in the spring, the best growth in a year.” Commentary at…
 
LITTLE SIGN OF RECESSION (Washington Post)
“The U.S. economy slowed in the spring but continues to grow at a healthy pace that shows little sign of a recession.” Story at…
 
OFF TOPIC BORDER WALL
I was surprised that the Supreme Court allowed the trump administration to reprogram funds from the military budget to border wall construction. It seems Constitutionally improper. As I wrote previously: 
“Funds are appropriated by Congress not by the President and they must be spent in a manner for which they were appropriated. It’s true by the law; it’s true by past practice and its true per the Constitution. It takes two acts of Congress to spend money: (1) an authorization bill (2) an appropriations bill, both signed into law by the President. The sad thing is, all Politicians swore an oath to uphold the Constitution.”
 
Apparently, the Court ruled on a technicality. It decided that the environmental groups that brought those challenges were inappropriate parties to bring a lawsuit about transferring federal funds, an argument put forth by U.S. Solicitor General Noel Francisco. Again, as I wrote before:
 
“If the Democrats want to impeach, they should impeach on Trump’s unconstitutional usurpation of powers granted to the Congress under the Constitution.  They won’t though.  The current impeach-Trump movement is nothing more than Political grandstanding designed to weaken Trump and win elections.”
 
I actually agree with the U.S. Solicitor General Noel Francisco who said, “Interests in hiking, birdwatching, and fishing in designated drug-smuggling corridors do not outweigh the harm to the public from halting the government’s efforts to construct barriers to stanch the flow of illegal narcotics across the southern border.”
 
Even so, this doesn’t change the requirement to follow the Constitution.  Ultimately, this goes back to the Congress’ failure.  They would rather blame Trump than solve the problem.
 
MARKET REPORT / ANALYSIS         
-Monday the S&P 500 dipped about 0.2% to 3021.
-VIX rose about 6% to 12.83.
-The yield on the 10-year Treasury slipped to 2.066%.
 
Today, there were few changes in the indicators, so here’s a run down of most of them.
BEAR SIGNS
-The Bollinger Squeeze remains in effect. This narrowing of the bands can foreshadow a significant advance or decline. Since other indicators are mostly bearish, we must conclude the direction of the move is likely to be down. 
-Breadth vs the S&P 500 index indicates that the Index is too far ahead of most stocks on the NYSE.
-The Index is 8.4% above its 200-dMA. That’s a mildly bearish sign. When sentiment is added to the equation, this one is solidly bearish. (I am not as concerned about this indicator as I might normally be. The 200-dMA is still nearly flat since it hasn’t recovered from the prior correction.  That means that this indicator may go higher – say in the 10-15% range above the 200-day – before we get a solid negative sign. It can get as high as 20% above the 200-dMA.)
-The Index is 3.5% above its 50-dMA. That’s bearish.
-Money Trend is falling, but not drastically.
-The Money Trend Indicator spread vs S&P 500 is too high.
-Statistically, the S&P 500 is too calm (measured by daily moves) suggesting some down moves ahead, often kicked off by a 2% (or more drop.).
-MACD is bearish, but it looks like it is now making a bullish crossover.
-Cyclical Industrials are under-performing the S&P 500.
 
NEUTRAL
-RSI remains neutral.
-Bollinger Bands are elevated but neutral.
-Sentiment is elevated but not in the red zone.
-The short-term Fosback High-Low Logic Index is neutral.  That is the only indicator that called the exact top of the 2018 19% correction.
-MACD analysis of Breadth is neutral, but it appears to be rolling over – a bearish sign if it does.
 
BULL SIGNS
-New-high/new-low data is bullish.
-Up moves have been bigger than down moves over the last month.
-VIX is falling nicely.
-The S&P 500 is outperforming the XLU-ETF (Utilities).
 
Overall, my daily sum of 20 Indicators remained +2 (a positive number is bullish; negatives are bearish) while the 10-day smoothed version that negates the daily fluctuations remained -6. (These numbers sometimes change after I post the blog based on data that comes in late.) Most of these indicators are short-term.
 
How long do I hang on before cutting some stock holdings? Bollinger bands and RSI will probably signal the top if other indicators remain negative.
 
TOP / BOTTOM INDICATOR SCALE OF 1 TO 10 (Zero is a neutral reading.)
Today’s Reading: -3      
Most Recent Day with a value other than Zero: -3 on 29 July (The S&P 500 was too far ahead of its 200-day average w/sentiment, top-indicator; the S&P 500 is stretched relative to breadth; the Money Trend Indicator is stretched relative to the S&P 500.)
(1) +10 Max Bullish / -10 Max Bearish)
(2) -4 or below is a Sell sign. +4 or better is a Buy Sign.
 
MOMENTUM ANALYSIS:
TODAY’S RANKING OF  15 ETFs (Ranked Daily)
 
The top ranked ETF receives 100%. The rest are then ranked based on their momentum relative to the leading ETF.  While momentum isn’t stock performance per se, momentum is closely related to stock performance. For example, over the 4-months from Oct thru mid-February 2016, the number 1 ranked Financials (XLF) outperformed the S&P 500 by nearly 20%. In 2017 Technology (XLK) was ranked in the top 3 Momentum Plays for 52% of all trading days in 2017 (if I counted correctly.) XLK was up 35% on the year while the S&P 500 was up 18%.
*For additional background on the ETF ranking system see NTSM Page at…
 
TODAY’S RANKING OF THE DOW 30 STOCKS (Ranked Daily)
The top ranked stock receives 100%. The rest are then ranked based on their momentum relative to the leading stock.
*I rank the Dow 30 similarly to the ETF ranking system. For more details, see NTSM Page at…
 
MONDAY MARKET INTERNALS (NYSE DATA)
Market Internals remained NEUTRAL on the market.
Market Internals are a decent trend-following analysis of current market action but should not be used alone for short term trading. They are usually right, but they are often late.  They are most useful when they diverge from the Index.  In 2014, using these internals alone would have made a 9% return vs. 13% for the S&P 500 (in on Positive, out on Negative – no shorting).
 
Using the Short-term indicator in 2018 in SPY would have made a 5% gain instead of a 6% loss for buy-and-hold. The methodology was Buy on a POSITIVE indication and Sell on a NEGATIVE indication and stay out until the next POSITIVE indication. The back-test included 13-buys and 13-sells, or a trade every 2-weeks on average.  
 
My current stock allocation is about 55% invested in stocks as of 4 June 2019. This is based on the improved indicators 3 June and my recommendation to increase stock holdings if we saw strong buying on 4 June. As a retiree, I am conservatively positioned with a balanced portfolio.  You may be comfortable with a higher % invested in stocks – that’s OK.
 
INTERMEDIATE / LONG-TERM INDICATOR
Monday, the PRICE and VIX indicators were positive; the SENTIMENT and VOLUME indicators were neutral. Overall, the Long-Term Indicator is BUY. The indicator is designed to signal Buy after a bottom.  At this point, it just means that conditions have been bullish; I think they may be too bullish and a decline is likely to be coming.

Friday, July 26, 2019

GDP – Adv … Stock Market Analysis… ETF Trading … Dow 30 Ranking

“Trade what you see; not what you think.” – The Old Fool, Richard McCranie, trader extraordinaire.
 
GDP - Adv
“GDP rose 2.1% in the second quarter, down from 3.1% in Q1. The growth was better than Wall Street estimates for a 2% gain.” Story at…
 
MARKET REPORT / ANALYSIS         
-Friday the S&P 500 rose about 0.8% to 3026.
-VIX dipped about 5% to 12.16.
-The yield on the 10-year Treasury slipped to 2.074%.
 
The % of stocks making new-highs today was 6.7% while the S&P 500 made a new high. This is a decent number that shows there is still decent breadth at today’s new all-time high.  
We can also measure breadth directly as the % of issues advancing on the NYSE. If we look at the last 4 all-time highs, we have seen the 10-dMA of %-issues advancing fall from 57.5% on 12 July to 52% Friday. It’s still above 50% (indicating that most stocks have advanced over the last 10-days) so this is not too much of a concern.
 
There was an unusual indicator that flashed today – Bollinger Squeeze. Here’s what stockcharts.com has to say about the Bollinger Squeeze:
“The Bollinger Band Squeeze occurs when volatility falls to low levels and the Bollinger Bands narrow. According to John Bollinger, periods of low volatility are often followed by periods of high volatility. Therefore, a volatility contraction or narrowing of the bands can foreshadow a significant advance or decline.” 
 
Since we have a number of stretched indicators, the most likely move will be down. As noted previously, we still see plenty of signs that a correction is coming.
The calm-before-the-storm indicator is still flashing a warning. (This is a similar indicator to the Bollinger Bands.) Expect a one-day 2% or more, drop coming ahead, most likely within the month. (This indicator is pretty good, but not perfect.)
 
In addition, we see other important indicators giving a warning.  Breadth is lagging the S&P 500 by an amount that frequently signals a top. (The last time we had a sell signal (20 Sep 2018) with this indicator, it signaled “sell” 8 trading-sessions before the top.) A similar indicator (Money Trend vs the S&P 500) is also stretched and warning of a top. We also note that the Index is stretched ahead of its 200-day moving average when sentiment is added to the equation.
 
My daily sum of 20 Indicators remained +2 (a positive number is bullish; negatives are bearish) while the 10-day smoothed version that negates the daily fluctuations slipped from +2 to -6. (These numbers sometimes change after I post the blog based on data that comes in late.) Most of these indicators are short-term.
 
There are bullish indicators, too, but it still looks like a correction is coming.
 
How long do I hang on before cutting some stock holdings? Bollinger bands and RSI will probably signal the top if other indicators remain negative.
 
TOP / BOTTOM INDICATOR SCALE OF 1 TO 10 (Zero is a neutral reading.)
Today’s Reading: -3      
Most Recent Day with a value other than Zero: -3 on 26 July (The S&P 500 was too far ahead of its 200-day average w/sentiment, top-indicator; the S&P 500 is stretched relative to breadth; the Money Trend Indicator is stretched relative to the S&P 500.)
(1) +10 Max Bullish / -10 Max Bearish)
(2) -4 or below is a Sell sign. +4 or better is a Buy Sign.
 
MOMENTUM ANALYSIS:
TODAY’S RANKING OF  15 ETFs (Ranked Daily)
 
The top ranked ETF receives 100%. The rest are then ranked based on their momentum relative to the leading ETF.  While momentum isn’t stock performance per se, momentum is closely related to stock performance. For example, over the 4-months from Oct thru mid-February 2016, the number 1 ranked Financials (XLF) outperformed the S&P 500 by nearly 20%. In 2017 Technology (XLK) was ranked in the top 3 Momentum Plays for 52% of all trading days in 2017 (if I counted correctly.) XLK was up 35% on the year while the S&P 500 was up 18%.
*For additional background on the ETF ranking system see NTSM Page at…
 
TODAY’S RANKING OF THE DOW 30 STOCKS (Ranked Daily)
The top ranked stock receives 100%. The rest are then ranked based on their momentum relative to the leading stock.
*I rank the Dow 30 similarly to the ETF ranking system. For more details, see NTSM Page at…
 
FRIDAY MARKET INTERNALS (NYSE DATA)
Market Internals remained NEUTRAL on the market.
Market Internals are a decent trend-following analysis of current market action but should not be used alone for short term trading. They are usually right, but they are often late.  They are most useful when they diverge from the Index.  In 2014, using these internals alone would have made a 9% return vs. 13% for the S&P 500 (in on Positive, out on Negative – no shorting).
 
Using the Short-term indicator in 2018 in SPY would have made a 5% gain instead of a 6% loss for buy-and-hold. The methodology was Buy on a POSITIVE indication and Sell on a NEGATIVE indication and stay out until the next POSITIVE indication. The back-test included 13-buys and 13-sells, or a trade every 2-weeks on average.  
 
My current stock allocation is about 55% invested in stocks as of 4 June 2019. This is based on the improved indicators 3 June and my recommendation to increase stock holdings if we saw strong buying on 4 June. As a retiree, I am conservatively positioned with a balanced portfolio.  You may be comfortable with a higher % invested in stocks – that’s OK.
 
INTERMEDIATE / LONG-TERM INDICATOR
Friday, the PRICE and VIX indicators were positive; the SENTIMENT and VOLUME indicators were neutral. Overall, the Long-Term Indicator is BUY. The indicator is designed to signal Buy after a bottom.  At this point, it just means that conditions have been bullish; I think they may be too bullish and a decline is likely to be coming.