Friday, July 31, 2020

Big Tech Crushes Earnings Personal Income … PCE Prices … Chicago PMI … Michigan Sentient … Coronavirus (Covid-19) … Stock Market Analysis … ETF Trading … Dow 30 Ranking

"Trade what you see; not what you think.” – The Old Fool, Richard McCranie, trader extraordinaire.
 
"This imaginary person out there - Mr. Market - he's kind of a drunken psycho. Some days he gets very enthused, some days he gets very depressed. And when he gets really enthused, you sell to him and if he gets depressed you buy from him. There's no moral taint attached to that." - Warren Buffett
 
“The big money is not in the buying and selling. But in the waiting.” - Charlie Munger, Vice Chairman, Berkshire Hathaway
 
BIG TECH CRUSHES EARNINGS (Yahoo News)
“…after the bell [Thursday], Apple, Alphabet, Facebook and Amazon reported their earnings results. Each bested expectations, and all but one are up sharply in after-hours trading.” Story at…
Other than Google, they were up double digits vs. the same quarter a year ago. Wow! What Pandemic? Apple was up more than 10% on the day.
 
PERSONAL INCOME (Pymnts.com)
“Disposable personal income fell by 1.4 percent in June to $255 billion while personal spending increased $738 billion, a nearly 6 percent rise… ‘The scale and unprecedented nature of the COVID-19-driven downturn will leave lingering scars during the recovery,” Bloomberg economists Yelena Shulyatyeva and Eliza Winger said in a commentary.’” Story at…
 
PCE PRICES (CNBC)
“Monthly inflation ticked up in June, driven by food and energy goods and services prices, though the trend remained muted. The personal consumption expenditures (PCE) price index excluding the volatile food and energy components rose 0.2%...” Story at…
 
CHICAGO PMI (MarketWatch)
“A measure of business conditions in the Chicago region came in at 51.9 in July, after registering 36.6 in June.” Story at…
 
UNIVERISTY OF MICHIGAN SENTIMENT (BusinessInsider.com)
“The University of Michigan's consumer-sentiment gauge snapped a two-month uptrend in July, offering an early sign that new coronavirus outbreaks are reversing the economic recovery.
The university's index of consumer sentiment fell to 73.2 from June's reading of 78.1.” Story at…
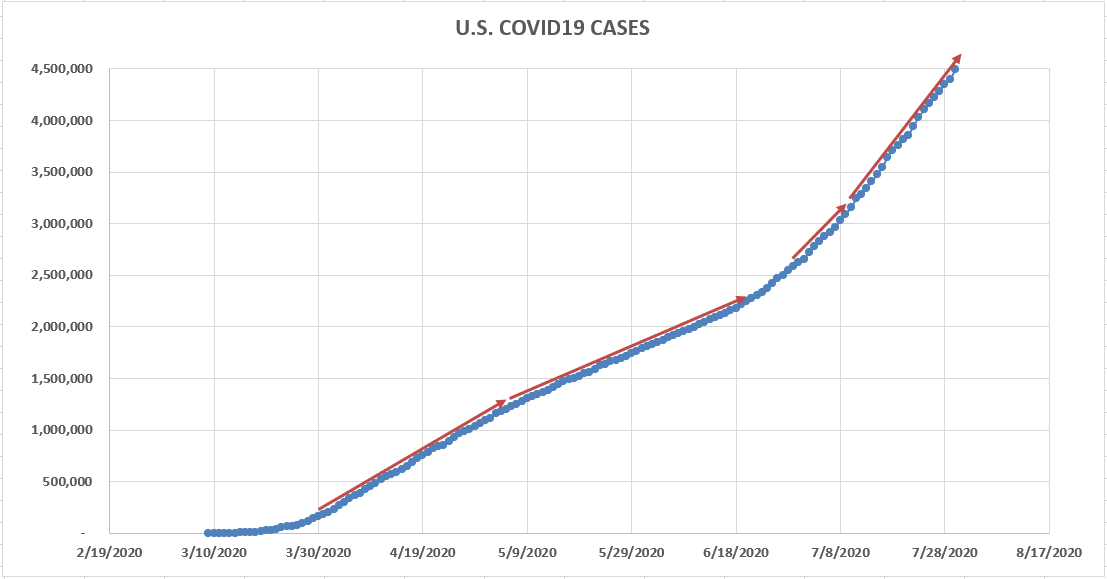
 
CORONAVIRUS (NTSM)
Here’s the latest from the COVID19 Johns Hopkins website as of 9:00 PM Friday. The US had about 65,000 new cases today. The curve of total US cases is still climbing steeply.
 
 
MARKET REPORT / ANALYSIS         
-Friday the S&P 500 rose about 0.8% to 3271.
-VIX dipped about 1% to 24.46.
-The yield on the 10-year Treasury slipped to 0.535%.
 
Today was a surprise all around. We got a weak open after great tech earnings reports followed by an afternoon bounce that saved the day. Still, internals were weak at the close as there was nearly 2 to 1 down-volume to up-volume and declining issues outpaced advancing issues. We probably aren’t out of this rough patch yet. The S&P 500 has gone sideways for nearly 3-weeks.
 
The daily sum of 20 Indicators remained -5 (a positive number is bullish; negatives are bearish). The 10-day smoothed sum that smooths the daily fluctuations declined from -3 to -7. (These numbers sometimes change after I post the blog based on data that comes in late.) Most of these indicators are short-term.
 
Here’s the Friday run-down of some important indicators. These tend to be both long-term and short-term so they are somewhat different than the 20 that I report on daily.
 
BULL SIGNS
-The percentage of 15-ETFs that are above their respective 120-dMA was 87% Friday, bullish.
-The 50-dMA of stocks advancing on the NYSE (Breadth) is above 50%.
-100-dMA of Breadth (advancing stocks on the NYSE) is above 50%.
-The 5-10-20 Timer System remained BUY, because the 5-dEMA and 10-dMA are above the 20-dEMA. 
 
NEUTRAL
- The S&P 500 is outperforming the Utilities ETF (XLU), but its outperformance is falling so let’s call this one neutral.
-The Fosback High-Low Logic Index dropped to neutral.
- Breadth on the NYSE vs the S&P 500 index diverged from the S&P 500 index and has been giving a sell signal since 11 May. 31 July it finally turned neutral. This indicator signaled a top at S&P 3207.
-The size of up-moves has been larger than the size of down-moves over the last month, but for now, it remains in neutral territory.
-VIX is Neutral.
-The S&P 500 is neutral relative to its 200-dMA. It is not too diverging too far above or below it.
-Statistically, the S&P 500 gave a panic-signal, 11 June. A panic signal usually suggests more to come.  We did not see big negative follow-thru so I’ll put this one in the negative category.
-Non-crash Sentiment is neutral.
-Bollinger Bands remain neutral, but are approaching an overbought reading. RSI is neutral.
-Overbought/Oversold Index, a measure of advance-decline data is neutral.
-Over the last 10 and 20-days, the number of up-days is neutral.
- The Smart Money (late-day action) is trending down, but only slightly bearish so I’ll put this one in the neutral camp. This indicator is based on the Smart Money Indicator (a variant of the indicator developed by Don Hayes).
 
BEAR SIGNS
-Only 45% of the 15-ETFs that I track have been up over the last 10-days – bearish.
-My Money Trend indicator is now headed down.
-Long-term new-high/new-low data is bearish.
-Short-term new-high/new-low data is bearish.
-MACD of S&P 500 price made a bearish crossover 27July.
-MACD of stocks advancing on the NYSE (breadth) made a bearish crossover 31 July.
- The smoothed advancing volume on the NYSE remained Bearish.
-Cyclical Industrials (XLI-ETF) are underperforming the S&P 500 – a bear sign.
 
On Friday, 21 February, 2 days after the top of this pullback, there were 10 bear-signs and 1 bull-sign. Now there are 4 bull-signs and 8 bear-signs. Last week there were 10 bull-signs and 3 bear-signs.
 
It sure feels like we are near a top; however, I don’t see major divergences in the internals although indicators are leaning bearish.  Top Indicators are silent. It looks like the markets can go higher, but the market has not made up its mind.  
 
MOMENTUM ANALYSIS:
TODAY’S RANKING OF  15 ETFs (Ranked Daily)
The top ranked ETF receives 100%. The rest are then ranked based on their momentum relative to the leading ETF. 
 
*For additional background on the ETF ranking system see NTSM Page at…
 
TODAY’S RANKING OF THE DOW 30 STOCKS (Ranked Daily)
The top ranked stock receives 100%. The rest are then ranked based on their momentum relative to the leading stock.
For more details, see NTSM Page at…
 
FRIDAY MARKET INTERNALS (NYSE DATA)
Market Internals remained NEUTRAL on the market.
Market Internals are a decent trend-following analysis of current market action, but should not be used alone for short term trading. They are usually right, but they are often late.  They are most useful when they diverge from the Index.  In 2014, using these internals alone would have made a 9% return vs. 13% for the S&P 500 (in on Positive, out on Negative – no shorting).
 
Using the Short-term indicator in 2018 in SPY would have made a 5% gain instead of a 6% loss for buy-and-hold. The methodology was Buy on a POSITIVE indication and Sell on a NEGATIVE indication and stay out until the next POSITIVE indication. The back-test included 13-buys and 13-sells, or a trade every 2-weeks on average.  
 
My current stock allocation is about 40% invested in stocks. You may wish to have a higher or lower % invested in stocks depending on your risk tolerance. 40% is a conservative position that I re-evaluate daily. It is not far below my fully invested position which would be between 50-60%.   
 
As a retiree, 50% in the stock market is about fully invested for me – it is a cautious and conservative number. If I feel very confident, I might go to 60%; had we seen a successful retest of the bottom, 80% would not have been out of the question.

Thursday, July 30, 2020

Jobless Claims … GDP-Adv … Markets Sending Confounding Messages … Coronavirus (Covid-19) … Stock Market Analysis … ETF Trading … Dow 30 Ranking

“Trade what you see; not what you think.” – The Old Fool, Richard McCranie, trader extraordinaire.
 
"This imaginary person out there - Mr. Market - he's kind of a drunken psycho. Some days he gets very enthused, some days he gets very depressed. And when he gets really enthused, you sell to him and if he gets depressed you buy from him. There's no moral taint attached to that." - Warren Buffett
 
“The big money is not in the buying and selling. But in the waiting.” - Charlie Munger, Vice Chairman, Berkshire Hathaway
 
JOBLESS CLAIMS (CNN Business)
“In yet another sign that the economic recovery is teetering in a resurgence of coronavirus cases, the number of Americans filing first-time unemployment claims rose for the second week in a row. Some 1.4 million people filed for initial jobless claims last week, up 12,000 from the prior week's revised level, which was the first increase in 16 weeks…” Story at…
 
GDP-ADV (CNBC)
“The U.S. economy saw the biggest quarterly plunge in activity ever, though the plummet in the second quarter wasn’t as bad as feared. Gross domestic product from April to June plunged 32.9% on an annualized basis, according to the Commerce Department’s first reading on the data released Thursday.” Story at…
 
MARKETS SENDING CONFOUNDING MESSAGES (Real Investment Advice)
“The fog of the Fed is rendering most traditional economic signs meaningless. Gauges to help manage risk are obscured and disfigured. Even more confusing, some signals are contradictory to each other. Just as drivers occasionally get caught in a thick fog, investors must navigate today’s markets differently than when the sun is shining.  Investors need to modify their behavior to exercise more caution.”  Commentary at…
 
CORONAVIRUS (NTSM)
Here’s the latest from the COVID19 Johns Hopkins website as of 10:20 PM Thursday. The US had about 95,000 new cases today. This is a new record, but it is partly because I got the data late. The curve of total US cases is still climbing steeply.
 
MARKET REPORT / ANALYSIS         
-Thursday the S&P 500 dipped about 0.4% to 3246.
-VIX rose about 3% to 24.76.
-The yield on the 10-year Treasury slipped to 0.536%.
 
Lazy reporters are telling us that today’s drop was caused by bad US-GDP numbers. No, it wasn't.  The futures were way down at 3AM more than 5 hours before the GDP data was released. The weakness might have been the result of poor numbers from Europe over night. Volkswagen cut their dividends on a near 30% drop in sales. The German DAX fell sharply, down almost 4% late in trading; but who knows. Guessing the cause of market action is often a pointless exercise, except when the Fed makes a move.
 
I had a computing error in the Indicator Sum yesterday. That has been corrected. Today, the daily sum of 20 Indicators declined from -5 to -4 (a positive number is bullish; negatives are bearish). The 10-day smoothed sum that smooths the daily fluctuations declined from +7 to -3. (These numbers sometimes change after I post the blog based on data that comes in late.) Most of these indicators are short-term.
 
It sure feels like we are near a top; however, I don’t see major divergences in the internals.  Top Indicators are silent. It looks like the markets can go higher.
 
MOMENTUM ANALYSIS:
TODAY’S RANKING OF  15 ETFs (Ranked Daily)
The top ranked ETF receives 100%. The rest are then ranked based on their momentum relative to the leading ETF. 
 
*For additional background on the ETF ranking system see NTSM Page at…
 
TODAY’S RANKING OF THE DOW 30 STOCKS (Ranked Daily)
The top ranked stock receives 100%. The rest are then ranked based on their momentum relative to the leading stock.
For more details, see NTSM Page at…
 
THURSDAY MARKET INTERNALS (NYSE DATA)
Market Internals remained NEUTRAL on the market.
Market Internals are a decent trend-following analysis of current market action, but should not be used alone for short term trading. They are usually right, but they are often late.  They are most useful when they diverge from the Index.  In 2014, using these internals alone would have made a 9% return vs. 13% for the S&P 500 (in on Positive, out on Negative – no shorting).
 
Using the Short-term indicator in 2018 in SPY would have made a 5% gain instead of a 6% loss for buy-and-hold. The methodology was Buy on a POSITIVE indication and Sell on a NEGATIVE indication and stay out until the next POSITIVE indication. The back-test included 13-buys and 13-sells, or a trade every 2-weeks on average.  
 
My current stock allocation is about 40% invested in stocks. You may wish to have a higher or lower % invested in stocks depending on your risk tolerance. 40% is a conservative position that I re-evaluate daily. It is not far below my fully invested position which would be between 50-60%.   
 
As a retiree, 50% in the stock market is about fully invested for me – it is a cautious and conservative number. If I feel very confident, I might go to 60%; had we seen a successful retest of the bottom, 80% would not have been out of the question.

Wednesday, July 29, 2020

FOMC Rate Decision … EIA Crude Oil Inventories … Coronavirus (Covid-19) … Stock Market Analysis … ETF Trading … Dow 30 Ranking

“Trade what you see; not what you think.” – The Old Fool, Richard McCranie, trader extraordinaire.
 
"This imaginary person out there - Mr. Market - he's kind of a drunken psycho. Some days he gets very enthused, some days he gets very depressed. And when he gets really enthused, you sell to him and if he gets depressed you buy from him. There's no moral taint attached to that." - Warren Buffett
 
“The big money is not in the buying and selling. But in the waiting.” - Charlie Munger, Vice Chairman, Berkshire Hathaway
 
FOMC RATE DECISION (CNBC)
“The Federal Reserve held interest rates steady in a decision announced Wednesday that came along with a tepid outlook on the coronavirus-plagued economy… “Following sharp declines, economic activity and employment have picked up somewhat in recent months but remain well below their levels at the beginning of the year,” the statement said.” Story at…
 
EIA CRUDE OIL INVENTORIES (Energy Information Administration)
“U.S. commercial crude oil inventories (excluding those in the Strategic Petroleum Reserve) decreased by 10.6 million barrels from the previous week. At 526.0 million barrels, U.S. crude oil inventories are about 17% above the five year average for this time of year.” Press release at…
 
CORONAVIRUS (NTSM)
Here’s the latest from the COVID19 Johns Hopkins website as of 5:45 PM Wednesday. The US had about 50,000 new cases today. The curve of total US cases is still climbing steeply.
 
MARKET REPORT / ANALYSIS         
-Wednesday the S&P 500 rose about 1.2% to 3258.
-VIX dropped about 5% to 24.1.
-The yield on the 10-year Treasury slipped to 0.577%.
 
The markets shrugged off yesterday’s weakness, liked the FOMC statement (because there were no surprises) and jumped higher.
 
The Bearish cross on MACD for S&P 500 remains while the MACD of NYSE Breadth stayed slightly bullish. On review, I think the best course is to follow these in tandem. A split decision (as we have now) is neutral.
 
The daily sum of 20 Indicators improved from -1 to -0 (a positive number is bullish; negatives are bearish). The 10-day smoothed sum that smooths the daily fluctuations declined from +17 to zero. (These numbers sometimes change after I post the blog based on data that comes in late.) Most of these indicators are short-term.
 
I don’t see major divergences in the internals.  Top Indicators are silent. It looks like the markets can go higher.
 
MOMENTUM ANALYSIS:
TODAY’S RANKING OF  15 ETFs (Ranked Daily)
The top ranked ETF receives 100%. The rest are then ranked based on their momentum relative to the leading ETF. 
 
*For additional background on the ETF ranking system see NTSM Page at…
 
TODAY’S RANKING OF THE DOW 30 STOCKS (Ranked Daily)
The top ranked stock receives 100%. The rest are then ranked based on their momentum relative to the leading stock.
For more details, see NTSM Page at…
 
WEDNESDAY MARKET INTERNALS (NYSE DATA)
Market Internals remained NEUTRAL on the market.
Market Internals are a decent trend-following analysis of current market action, but should not be used alone for short term trading. They are usually right, but they are often late.  They are most useful when they diverge from the Index.  In 2014, using these internals alone would have made a 9% return vs. 13% for the S&P 500 (in on Positive, out on Negative – no shorting).
 
Using the Short-term indicator in 2018 in SPY would have made a 5% gain instead of a 6% loss for buy-and-hold. The methodology was Buy on a POSITIVE indication and Sell on a NEGATIVE indication and stay out until the next POSITIVE indication. The back-test included 13-buys and 13-sells, or a trade every 2-weeks on average.  
 
My current stock allocation is about 40% invested in stocks. You may wish to have a higher or lower % invested in stocks depending on your risk tolerance. 40% is a conservative position that I re-evaluate daily. It is not far below my fully invested position which would be between 50-60%.   
 
As a retiree, 50% in the stock market is about fully invested for me – it is a cautious and conservative number. If I feel very confident, I might go to 60%; had we seen a successful retest of the bottom, 80% would not have been out of the question.

Tuesday, July 28, 2020

Consumer Confidence … Coronavirus (Covid-19) … Stock Market Analysis … ETF Trading … Dow 30 Ranking

“Trade what you see; not what you think.” – The Old Fool, Richard McCranie, trader extraordinaire.
 
"This imaginary person out there - Mr. Market - he's kind of a drunken psycho. Some days he gets very enthused, some days he gets very depressed. And when he gets really enthused, you sell to him and if he gets depressed you buy from him. There's no moral taint attached to that." - Warren Buffett
 
“The big money is not in the buying and selling. But in the waiting.” - Charlie Munger, Vice Chairman, Berkshire Hathaway
 
CONSUMER CONFIDENCE
 The Conference Board Consumer Confidence Index® decreased in July, after increasing in June. The Index now stands at 92.6 (1985=100), down from 98.3 in June. The Present Situation Index – based on consumers’ assessment of current business and labor market conditions – improved from 86.7 to 94.2. However, the Expectations Index – based on consumers’ short-term outlook for income, business, and labor market conditions – decreased from 106.1 in June to 91.5 this month…“Consumer Confidence declined in July following a large gain in June,” said Lynn Franco, Senior Director of Economic Indicators at The Conference Board. “The Present Situation Index improved, but the Expectations Index retreated. Large declines were experienced in Michigan, Florida, Texas and California, no doubt a result of the resurgence of COVID-19. Looking ahead, consumers have grown less optimistic about the short-term outlook for the economy and labor market and remain subdued about their financial prospects. Such uncertainty about the short-term future does not bode well for the recovery, nor for consumer spending.” Press release at…
 
CORONAVIRUS (NTSM)
Here’s the latest from the COVID19 Johns Hopkins website as of 10:20 PM Tuesday. The US had about 72,000 new cases today roughly 10% below recent, record daily-levels. The curve of total US cases is still climbing steeply.
 
My daughter the ER nurse gets pissed off at the COVID neigh Sayers.  She says if you had to put a 6-year old in a body-bag (as she did) you might feel differently about it. As she pointed out, a recent German study found that 80% of COVID patients had permanent heart damage. Another problem her hospital is all too familiar with, Babies born with COVID, or a COVID positive Mom, are at very high risk for SIDS (Sudden Infant Death Syndrome.) Wear masks stupid people.
 
MARKET REPORT / ANALYSIS         
-Tuesday the S&P 500 dipped about 0.7% to 3218.
-VIX rose about 3% to 25.44.
-The yield on the 10-year Treasury dropped to 0.582%.
 
Late day action was decidedly bearish as the S&P 500 dropped about ¾-percent from 2PM into the close.  It closed at its low for the day, suggesting more bearishness ahead since it may carry over into tomorrow. (Futures are flat as I write this.)    
 
Overall volume has been falling, but it remains above its pre-crash levels so my concerns about falling volume a few weeks back may have been overblown. There are recent bearish signs, though.
 
The Bearish cross on MACD for S&P 500 got more bearish, while the MACD of NYSE Breadth stayed about the same – slightly bullish. I’m not sure which one to believe. I suppose I remain a skeptical bull, but with recent weakness, Consumer Confidence falling and Coronavirus news getting worse, we may need a more bearish stance.
 
The daily sum of 20 Indicators improved from -3 to -1 (a positive number is bullish; negatives are bearish). The 10-day smoothed sum that smooths the daily fluctuations declined from +19 to +17. (These numbers sometimes change after I post the blog based on data that comes in late.) Most of these indicators are short-term.
 
I don’t see major divergences in the internals.  Utilities outperformed relative to the S&P 500 today, but the Index is still outperforming on a longer term – no sign of a pullback in that indicator. Friday’s indicator review looked pretty good, too. Until we see some more negative signs, it looks like the markets can go higher. Tomorrow may be telling, if the markets can shake off today’s weakness and move higher. Otherwise, some further consolidation may be in the works.
 
MOMENTUM ANALYSIS:
TODAY’S RANKING OF  15 ETFs (Ranked Daily)
The top ranked ETF receives 100%. The rest are then ranked based on their momentum relative to the leading ETF. 
 
*For additional background on the ETF ranking system see NTSM Page at…
 
TODAY’S RANKING OF THE DOW 30 STOCKS (Ranked Daily)
The top ranked stock receives 100%. The rest are then ranked based on their momentum relative to the leading stock.
For more details, see NTSM Page at…
 
TUESDAY MARKET INTERNALS (NYSE DATA)
Market Internals remained NEUTRAL on the market.
Market Internals are a decent trend-following analysis of current market action, but should not be used alone for short term trading. They are usually right, but they are often late.  They are most useful when they diverge from the Index.  In 2014, using these internals alone would have made a 9% return vs. 13% for the S&P 500 (in on Positive, out on Negative – no shorting).
 
Using the Short-term indicator in 2018 in SPY would have made a 5% gain instead of a 6% loss for buy-and-hold. The methodology was Buy on a POSITIVE indication and Sell on a NEGATIVE indication and stay out until the next POSITIVE indication. The back-test included 13-buys and 13-sells, or a trade every 2-weeks on average.  
 
My current stock allocation is about 40% invested in stocks. You may wish to have a higher or lower % invested in stocks depending on your risk tolerance. 40% is a conservative position that I re-evaluate daily. It is not far below my fully invested position which would be between 50-60%.   
 
As a retiree, 50% in the stock market is about fully invested for me – it is a cautious and conservative number. If I feel very confident, I might go to 60%; had we seen a successful retest of the bottom, 80% would not have been out of the question.

Monday, July 27, 2020

Durable Orders … Markit Flash PMI … Investos Worry about Exuberence … Scientists Struggle with Silent Spread of Coronavirus … Coronavirus (Covid-19) … Stock Market Analysis … ETF Trading … Dow 30 Ranking

"This imaginary person out there - Mr. Market - he's kind of a drunken psycho. Some days he gets very enthused, some days he gets very depressed. And when he gets really enthused, you sell to him and if he gets depressed you buy from him. There's no moral taint attached to that." - Warren Buffett
 
“The big money is not in the buying and selling. But in the waiting.” - Charlie Munger, Vice Chairman, Berkshire Hathaway
 
DURABLE ORDERS
Orders for durable goods lasting at least three years rose strongly in June for the second straight month after historic declines in the early spring, but the momentum might be hard to sustain in the wake of more coronavirus cases and somewhat tighter government restrictions. Orders climbed 7.3% last month, the government said Monday.” Story at…
 
MARKIT FLASH U.S. COMPOSITE PMI (Markit Economics)
“While the stabilisation of business activity in July is welcome news, the lack of growth is a disappointment. Moreover, a renewed acceleration in the rate of loss of new business raises concerns that demand is faltering. Many companies, notably in consumer-facing areas of the service sector, linked falling sales to re-imposed lockdowns.” - Chris Williamson, Chief Business Economist at IHS Markit.” Press release at…
 
EARNINGS (FACTSET)
“The blended (combines actual results for companies that have reported and estimated results for companies that have yet to report) earnings decline for the second quarter is -42.4%, which is smaller than the earnings decline of -44.1% last week. Positive earnings surprises reported by companies in the Health Care and Information Technology sectors were mainly responsible for the decrease in the overall earnings decline during the week. If -42.4% is the actual decline for the quarter, it will mark the largest year-over-year decline in earnings reported by the index since Q4 2008 (-69.1%). It will also mark the fifth time in the past six quarters in which the index has reported a year-over-year decline in earnings.”  Commentary at...
My cmt: Don’t worry, it’s ok because they exceeded estimates. Note that a year before the epidemic, earnings were declining. Ruh-roh!
 
INVESTORS WORRY ABOUT EXUBERENCE (Reuters)
“The equity market’s leadership and frenzied buying by retail investors “is classic bear market rally activity,” said Gundlach, and feels similar to 1999 - which was prior to the dotcom bubble bursting.
However, it is “way worse because we don’t have the ability to cut interest rates” and have “used all the tools that are typically reserved for fighting economic problems,” he said…
…“In the U.S. right now we are seeing a bit of ‘what does this mean?’” said Jim Schaeffer, head of leveraged finance at Aegon Asset Management. “We sold on the complete unknown and rallied on hope.” Story at…
 
SCIENTISTS STRUGGLE WITH SILENT SPREAD (CBC)
“One of the great mysteries of the novel coronavirus is how quickly it rocketed around the world. It first flared in central China and within three months was on every continent but Antarctica, shutting down daily life for millions. Behind the rapid spread was something that initially caught scientists off guard, baffled health authorities and undermined early containment efforts: The virus could be spread by seemingly healthy people.” Interesting article at… https://www.cbc.ca/news/health/covid-19-silent-spread-1.5658639


CORONAVIRUS (NTSM)
Here’s the latest from the COVID19 Johns Hopkins website as of 7:19 PM Monday. The US averaged about 57,000 new cases per day over the last three days. Down somewhat from recent levels. We’ll have to see if this is just the “weekend effect” or a real reduction.


MARKET REPORT / ANALYSIS         
-Monday the S&P 500 rose about 0.7% to 3239.
-VIX slipped about 4% to 24.74.
-The yield on the 10-year Treasury rose to 0.612%.
 
Today there was a Bearish cross on MACD for S&P 500 price, while the MACD of NYSE Breadth got more bullish. I’m not sure which one to believe. I supposed I remain a skeptical bull.
 
The daily sum of 20 Indicators declined -4 to -3 (a positive number is bullish; negatives are bearish). The 10-day smoothed sum that smooths the daily fluctuations declined from +26 to +19. (These numbers sometimes change after I post the blog based on data that comes in late.) Most of these indicators are short-term.
 
I don’t see major divergences in the internals.  Utilities fell relative to the S&P 500 – no sign of a pullback in that indicator. Friday’s indicator review looked pretty good. Looks like the markets can go higher.
 
MOMENTUM ANALYSIS:
TODAY’S RANKING OF  15 ETFs (Ranked Daily)
The top ranked ETF receives 100%. The rest are then ranked based on their momentum relative to the leading ETF. 

 
*For additional background on the ETF ranking system see NTSM Page at…
 
TODAY’S RANKING OF THE DOW 30 STOCKS (Ranked Daily)
The top ranked stock receives 100%. The rest are then ranked based on their momentum relative to the leading stock.
For more details, see NTSM Page at…
 
MONDAY MARKET INTERNALS (NYSE DATA)
Market Internals remained NEUTRAL on the market.
Market Internals are a decent trend-following analysis of current market action, but should not be used alone for short term trading. They are usually right, but they are often late.  They are most useful when they diverge from the Index.  In 2014, using these internals alone would have made a 9% return vs. 13% for the S&P 500 (in on Positive, out on Negative – no shorting).
 
Using the Short-term indicator in 2018 in SPY would have made a 5% gain instead of a 6% loss for buy-and-hold. The methodology was Buy on a POSITIVE indication and Sell on a NEGATIVE indication and stay out until the next POSITIVE indication. The back-test included 13-buys and 13-sells, or a trade every 2-weeks on average.  
 
My current stock allocation is about 40% invested in stocks. You may wish to have a higher or lower % invested in stocks depending on your risk tolerance. 40% is a conservative position that I re-evaluate daily. It is not far below my fully invested position which would be between 50-60%.   
 
As a retiree, 50% in the stock market is about fully invested for me – it is a cautious and conservative number. If I feel very confident, I might go to 60%; had we seen a successful retest of the bottom, 80% would not have been out of the question.