Tuesday, February 28, 2023

Consumer Confidence ... Chicago PMI ... Momentum Trading DOW Stocks & ETFs … Stock Market Analysis ...

 “Trade what you see; not what you think.” – The Old Fool, Richard McCranie, trader extraordinaire.
 
“The Wall Street Journal reports that the Energy Department has concluded [based on a classified intelligence report] that the COVID pandemic most likely arose from a laboratory leak...the most alarming aspect was the censorship, not the science. As late as May 2021, the New York Times’ Science and Health reporter Apoorva Mandavilli was calling any mention of the lab theory as “racist.” She embodies the model of the new “advocacy journalism” at the Times. Reporters who remained wedded to the dated view of objective journalism were purged from the ranks of The Times long ago.” - Jonathon Turley, attorney and a professor at George Washington University Law School.
 
CONSUMER CONFIDENCE (Conference Board)
The Conference Board Consumer Confidence Index decreased in February for the second consecutive month. The Index now stands at 102.9 (1985=100), down from 106.0 in January (a downward revision)...Consumer confidence declined again in February. The decrease reflected large drops in confidence for households aged 35 to 54 and for households earning $35,000 or more...And, while 12-month inflation expectations improved—falling to 6.3 percent from 6.7 percent last month—consumers may be showing early signs of pulling back spending in the face of high prices and rising interest rates.” Report at... 
https://www.conference-board.org/topics/consumer-confidence/press/CCI-Feb-2023
 
CHICAGO PMI (fxEmpire)
“The report indicated that Chicago PMI declined from 44.3 in January to 43.6 in February, compared to analyst consensus of 45. Chicago PMI is declining for the second month in a row.” Story at...
https://www.fxempire.com/news/article/cb-consumer-confidence-misses-expectations-sp-500-remains-under-pressure-1296969
 
WHAT’S CAUSING INFLATION (msn.com)

“According to Shapiro’s work [at the San Francisco Federal Reserve Bank], inflation for components categorized as supply-driven for the month of December amounted to 2.3% and for demand components 1.7%. Components that are not clearly affected by either supply or demand are categorized as ambiguous and given their own inflation number... “I think what the series is actually most beneficial at is it helps tell the story of how the supply and demand shocks have evolved over the pandemic and that it’s not just one or the other,” Shapiro said.” Story at...
Confused about what’s causing inflation? This metric shows what’s driving the price rise. (msn.com)
My cmt: The Fed can slow demand by raising rates and slowing the economy; but the above chart shows that a lot of the inflation is supply driven. I don’t see how the Fed can increase supply.
 
MARKET REPORT / ANALYSIS
-Tuesday the S&P 500 dropped about 0.3% to 3970.
-VIX dipped about 1% to 20.69.
-The yield on the 10-year Treasury was little changed at 3.924%.
 
PULLBACK DATA:
-Drop from Top: 17.2% as of today. 25.4% max (on a closing basis).
-Trading Days since Top: 289-days.
The S&P 500 is 0.8% ABOVE its 200-dMA & 0.2% BELOW its 50-dMA.
*I won’t call the correction over until the S&P 500 makes a new-high; however, evidence suggests the bottom was in the 3600 area.
 
MY TRADING POSITIONS:
QLD – 2xNasdaq 100 (added today)
 
SSO – 2x S&P 500
XLK – Technology ETF.
XLE – Energy Sector ETF. It hasn’t been doing much recently, but Russia is cutting production and that should help the sector.  We have a good dividend in the meantime.
BA – (Boeing) I am late on this one, but we’ll see.
XLY - Consumer Discretionary ETF.
 
SHY – Short term bonds. 30-day yield is 4.2%. (Trailing 1-year yield is 1.3%.) I’ll hold this, but if the market retests the lows, I’ll sell it and buy stocks.)
 
TODAY’S COMMENT:
Is the rally running on empty? Internals were very good all day while the S&P 500 price fluctuated. In the end, internals were leaning negative and the Index went down.
 
As we observed yesterday, Consumer Discretionary (XLY) outperformed the S&P while Utilities (XLU) sold off. Cyclical Industrials (XLI) slightly outperformed as well. Volume picked up late in the day and total volume for the day was about 20% above the monthly average. All of this suggests that today may have been heavily influenced by end of month adjustments by mutual funds and traders.
 
RSI was oversold (bullish), but Bollinger Bands were not.
 
Today, (Tuesday) unchanged volume was very high. As I’ve often said, many believe that this indicator suggests investor confusion at market turning points. My problem is that it is frequently a false signal; however, the last 2 times we saw this indicator near the lower trend line, (as it is now) the S&P 500 bounced higher. I don’t use this indicator in my system, but now, it does look bullish.
 
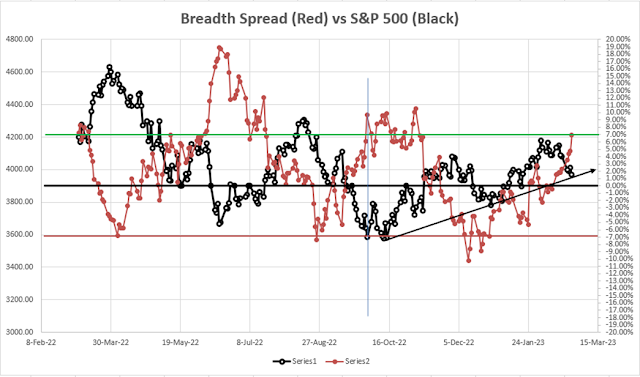
Here's another indicator I track, but I don’t use in my system. The chart shows the spread between Junk Bonds and the S&P 500 measured as % change in price. The upward sloping spread (red line) indicates a bullish divergence. The Black line is the S&P 500.
 

All in all, today’s action doesn’t affect my thinking – I remain bullish and heavily invested in stocks.
 
Today, the daily spread of 20 Indicators (Bulls minus Bears) declined from +5 to +1 (a positive number is bullish; negatives are bearish); the 10-day smoothed sum that smooths the daily fluctuations declined from +12 to +5. (The trend direction is more important than the actual number for the 10-day value.) These numbers sometimes change after I post the blog based on data that comes in late. Most of these 20 indicators are short-term so they tend to bounce around a lot.
 
LONG-TERM INDICATOR: The Long Term NTSM indicator remained HOLD: PRICE is positive; VIX & SENTIMENT are neutral.  VOLUME was negative.
 
(The important BUY in this indicator was on 21 October, 7-days after the bottom. For my NTSM overall signal, I suggested that a short-term buying opportunity occurred on 27 September (based on improved market internals on the retest), although without market follow-thru, I was unwilling to call a buy; however, I did close shorts and increased stock holdings. I issued a Buy-Signal on 4 October, 6-days before the final bottom, based on stronger market action that confirmed the market internals signal. The NTSM sell-signal was issued 20 December, 8 sessions before the high of this recent bear market, based on the bearish Friday rundown of indicators.)
 
Bottom line: I remain a BULL, although somewhat more cautious.
 
ETF - MOMENTUM ANALYSIS:
TODAY’S RANKING OF 15 ETFs (Ranked Daily)
ETF ranking follows:

The top ranked ETF receives 100%. The rest are then ranked based on their momentum relative to the leading ETF.
*For additional background on the ETF ranking system see NTSM Page at…
http://navigatethestockmarket.blogspot.com/p/exchange-traded-funds-etf-ranking.html
 
DOW STOCKS - TODAY’S MOMENTUM RANKING OF THE DOW 30 STOCKS (Ranked Daily)
DOW 30 momentum ranking follows:

The top ranked Stock receives 100%. The rest are then ranked based on their momentum relative to the leading Stock.
For more details, see NTSM Page at…
https://navigatethestockmarket.blogspot.com/p/a-system-for-trading-dow-30-stocks-my_8.html
 
TUESDAY MARKET INTERNALS (NYSE DATA)
My basket of Market Internals declined to SELL.
(Market Internals are a decent trend-following analysis of current market action, but should not be used alone for short term trading. They are most useful when they diverge from the Index.) 
 
 
...My current invested position is about 75% stocks, including stock mutual funds and ETFs. I’m usually about 50% invested in stocks.
 
I trade about 15-20% of the total portfolio using the momentum-based analysis I provide here. If I can see a definitive bottom, I’ll add a lot more stocks to the portfolio using an S&P 500 ETF.

Monday, February 27, 2023

Durable Orders ... Momentum Trading DOW Stocks & ETFs … Stock Market Analysis ...

"I have been investing for 80 years – more than one-third of our country’s lifetime. Despite our citizens’ penchant – almost enthusiasm – for self-criticism and self-doubt, I have yet to see a time when it made sense to make a long-term bet against America...And I doubt very much that any reader of this letter will have a different experience in the future." – Warren Buffet, shareholder letter.
 
“The Supreme Court hears one of the most consequential separation-of-powers cases in American history on Tuesday when it considers President Biden’s unilateral student loan write-off. The question is nothing less than whether the President can steal Congress’s power of the purse and act like a King.” – WSJ Editorial Board.
 
“Trade what you see; not what you think.” – The Old Fool, Richard McCranie, trader extraordinaire.
 
DURABLE ORDERS (Reuters)
“New orders for key U.S.-manufactured capital goods increased by the most in five months in January while shipments of those so-called core goods rebounded, suggesting that business spending on equipment picked up at the start of the first quarter...New orders for key U.S.-manufactured capital goods increased by the most in five months in January while shipments of those so-called core goods rebounded, suggesting that business spending on equipment picked up at the start of the first quarter.” Story at...
https://www.reuters.com/markets/us/us-core-capital-goods-orders-accelerate-january-2023-02-27/
 
EARNINGS (FactSet)
“With 82% of S&P 500 companies reporting results for Q4 2022 to date, aggregate earnings reported by these companies have exceeded estimated earnings by 1.3%. How does this earnings surprise percentage compare to recent averages? The earnings surprise percentage for Q4 2022 is below the 1-year average (+3.7%), below the 5-year average (+8.6%), and below the 10-year average (+6.4%).
In fact, the fourth quarter currently marks the second-lowest earnings surprise percentage reported by the index since Q4 2008, trailing only Q1 2020 (+1.1%). It also marks the seventh consecutive quarter in which the EPS surprise percentage for the index has decreased. Report at...
https://insight.factset.com/sp-500-companies-are-reporting-smaller-eps-surprises-for-7th-straight-quarter-in-q4?_ga=2.150632112.743530742.1677385973-1279003839.1673999577&_gac=1.180230486.1677385973.Cj0KCQjwhsmaBhCvARIsAIbEbH7Q7NBZbdr9ETvcmI_93_TwPm8ZjT78St2MJ__6E43gyC3KFNNl2pkaAuCZEALw_wcB&_gl=1*1rif377*_ga*MTI3OTAwMzgzOS4xNjczOTk5NTc3*_ga_2Q3PTT96M8*MTY3NzM4NTk3My4yLjAuMTY3NzM4NTk3My4wLjAuMA..
 
RECESSIONCOUNTDOWN BEGINS (RIA)
“...we must acknowledge the “possibility” of Goldman Sachs’ view of a soft landing. However, as we will discuss next, the “probabilities” of a recession seem far more significant...
...The recession countdown has started, but given the massive amount of liquidity still in the system, a recession may take longer to manifest itself this time. Such is why using the “yield curve” as a “market timing” tool is unwise. However, dismissing yield curve inversions entirely is just as foolish. History has not been kind to those that do.”
https://realinvestmentadvice.com/newsletter/
My cmt: So far, the stock market has suggested that the recession (if it occurs) may be pretty far off. Let’s hope the market keeps sending that signal. If it does, the S&P 500 must hold its 200dMA.
 
BEARS TESTING THE DOWNSIDE (Heritage Capital, Friday, 24 Feb)
“Right now, stocks have pulled back roughly 5% and that’s about the extent of what I see if my strongly bullish thesis is to continue to play out. In other words, I want to see the stock market find a low early next week and then strongly rally to the end of Q1.” – Paul Schatz, President, Heritage Capital.
https://investfortomorrow.com/blog/bears-testing-the-downside/
 
MARKET REPORT / ANALYSIS
-Monday the S&P 500 rose about 0.3% to 3970.
-VIX dropped about 3% to 21.67.
-The yield on the 10-year Treasury dipped to 3.923%.
 
PULLBACK DATA:
-Drop from Top: 17.0% as of today. 25.4% max (on a closing basis).
-Trading Days since Top: 283-days.
The S&P 500 is 1.1% ABOVE its 200-dMA & 0.1% ABOVE its 50-dMA.
*I won’t call the correction over until the S&P 500 makes a new-high; however, evidence suggests the bottom was in the 3600 area.
 
MY TRADING POSITIONS:
QLD – 2xNasdaq 100 (added today)
 
SSO – 2x S&P 500
XLK – Technology ETF.
XLE – Energy Sector ETF. It hasn’t been doing much recently, but Russia is cutting production and that should help the sector.  We have a good dividend in the meantime.
BA – (Boeing) I am late on this one, but we’ll see.
XLY - Consumer Discretionary ETF.
 
SHY – Short term bonds. 30-day yield is 4.2%. (Trailing 1-year yield is 1.3%.) I’ll hold this, but if the market retests the lows, I’ll sell it and buy stocks.)
 
TODAY’S COMMENT:
Today was constructive for the markets.  The S&P 500 stayed above its 200-dMA and bounced above its 50-dMA. Chart wise, these are important steps. There were other good signs, too. Cyclical Industrials (XLI) and Consumer Discretionary (XLY) both outperformed the S&P 500 while Utilities (XLU) sold off.  Those are bullish signs.  
 
I think markets go higher and make new highs; but the Mr. Market doesn’t listen to me.  We could always see a retest of the prior lows, so I’ll be vigilant in watching indicators for possible reversals.  
 
Today, the daily spread of 20 Indicators (Bulls minus Bears) improved from zero to +5 (a positive number is bullish; negatives are bearish); the 10-day smoothed sum that smooths the daily fluctuations improved from +6 to +12. (The trend direction is more important than the actual number for the 10-day value.) These numbers sometimes change after I post the blog based on data that comes in late. Most of these 20 indicators are short-term so they tend to bounce around a lot.
 
LONG-TERM INDICATOR: The Long Term NTSM indicator remained HOLD: PRICE is positive; VIX & SENTIMENT are neutral.  VOLUME was negative.
 
(The important BUY in this indicator was on 21 October, 7-days after the bottom. For my NTSM overall signal, I suggested that a short-term buying opportunity occurred on 27 September (based on improved market internals on the retest), although without market follow-thru, I was unwilling to call a buy; however, I did close shorts and increased stock holdings. I issued a Buy-Signal on 4 October, 6-days before the final bottom, based on stronger market action that confirmed the market internals signal. The NTSM sell-signal was issued 20 December, 8 sessions before the high of this recent bear market, based on the bearish Friday rundown of indicators.)
 
Bottom line: I remain a BULL, although somewhat more cautious.
 
ETF - MOMENTUM ANALYSIS:
TODAY’S RANKING OF 15 ETFs (Ranked Daily)
ETF ranking follows:

The top ranked ETF receives 100%. The rest are then ranked based on their momentum relative to the leading ETF.
*For additional background on the ETF ranking system see NTSM Page at…
http://navigatethestockmarket.blogspot.com/p/exchange-traded-funds-etf-ranking.html

DOW STOCKS - TODAY’S MOMENTUM RANKING OF THE DOW 30 STOCKS (Ranked Daily)
DOW 30 momentum ranking follows:

The top ranked Stock receives 100%. The rest are then ranked based on their momentum relative to the leading Stock.
For more details, see NTSM Page at…
https://navigatethestockmarket.blogspot.com/p/a-system-for-trading-dow-30-stocks-my_8.html

MONDAY MARKET INTERNALS (NYSE DATA)
My basket of Market Internals remained HOLD.
(Market Internals are a decent trend-following analysis of current market action, but should not be used alone for short term trading. They are most useful when they diverge from the Index.) 
 
 
...My current invested position is about 75% stocks, including stock mutual funds and ETFs. I’m usually about 50% invested in stocks.
 
I trade about 15-20% of the total portfolio using the momentum-based analysis I provide here. If I can see a definitive bottom, I’ll add a lot more stocks to the portfolio using an S&P 500 ETF.

Buying QLD

I am adding QLD.  Advance / declines look good today. This bumps me up to about 75% invested in stocks, stock mutual funds and stock ETFs. 

The S&P 500 bounced up from its 200-dMA and its lower trend line last week. Currently, the S&P 500 is above its 50-dMA. I remain bullish

Friday, February 24, 2023

PCE Prices ... Personal Spending ... New Home Sales ... Momentum Trading DOW Stocks & ETFs … Stock Market Analysis ...

 
“Putin blames the west for his genocidal invasion of Ukraine.” – Michael Ramirez.
https://michaelpramirez.com/index.html
 
“This thing [Ukrainian war] has to stop, and it’s got to stop now...The United States should negotiate peace between these two countries, and I don’t think they should be sending very much...[I’ll] clean house of all the warmongers and America-Last globalists.” – Former President Donald Trump.
My cmt: I remember when Nikita Khruschev pounded his shoe on a desk at the UN and screamed, “We will bury you.” America First devotees should consider that standing up to Russia is America First. Supporting Ukraine also sends a message to China regarding their ambitions in Taiwan. 
 
“Trade what you see; not what you think.” – The Old Fool, Richard McCranie, trader extraordinaire.
 
PCE PRICES (Benzinga)
“The headline PCE rose 5.4% in January. That's up from a 5.3% gain in December but still well below its 2022 high of a 7% increase in June. The January PCE reading came in well above economist estimates of 4.9%. Core PCE inflation, which excludes volatile food and energy prices, was up 4.7% in January, above economist estimates of 4.3%.” Story at...
https://www.benzinga.com/analyst-ratings/analyst-color/23/02/31049404/big-upside-surprise-experts-react-to-4-7-core-pce-inflation-as-interest-rate-expect
 
PERSONAL SPENDING (fxStreet)
“Real personal spending shot higher in January, and solid growth in discretionary services suggests continued consumer resilience...Real personal spending got a lift again to start the year, and in jumping 1.1% in January...” Story at... 
https://www.fxstreet.com/analysis/january-personal-income-and-spending-signs-of-resilience-beneath-volatility-202302241509
 
NEW HOME SALES (NY Post)
“Sales of new US single-family homes jumped to a 10-month high in January as prices declined, but a resurgence in mortgage rates could slow a much anticipated housing market turnaround. New home sales increased 7.2%...” Story at...
https://nypost.com/2023/02/24/january-new-home-sales-jump-to-10-month-high-as-prices-fall/
 
MARKET REPORT / ANALYSIS
-Friday the S&P 500 fell about 1.1% to 3970.
-VIX rose about 3% to 21.67.
-The yield on the 10-year Treasury rose to 3.953%.
 
PULLBACK DATA:
-Drop from Top: 17.2% as of today. 25.4% max (on a closing basis).
-Trading Days since Top: 283-days.
The S&P 500 is 0.8% ABOVE its 200-dMA & 0.3% BELOW its 50-dMA.
*I won’t call the correction over until the S&P 500 makes a new-high; however, evidence suggests the bottom was in the 3600 area.
 
MY TRADING POSITIONS:
SSO – 2x S&P 500 (added today)
 
XLK – Technology ETF.
XLE – Energy Sector ETF. It hasn’t been doing much recently, but Russia is cutting production and that should help the sector.  We have a good dividend in the meantime.
BA – (Boeing) I am late on this one, but we’ll see.
XLY - Consumer Discretionary ETF.
 
SHY – Short term bonds. 30-day yield is 4.2%. (Trailing 1-year yield is 1.3%.) I’ll hold this, but if the market retests the lows, I’ll sell it and buy stocks.)
 
TODAY’S COMMENT:
The S&P 500 broke below its 50-dMA, bounced off the 200-dMA and closed just above its lower trend line (black sloping line) in the chart below. In addition, my Breadth Spread (comparing breadth to the S&P 500 in the below chart), Bollinger Bands & RSI are all very close to giving a buy signal. (They were all buy when I checked earlier in the day and I thought they all were at the close - oops.) I did buy SSO (2x S&P 500) near the close.
I am still bullish – I’ll get very worried if the S&P 500 breaks lower and closes below the 200-dMA on successive days.
 
It’s Friday so it’s time to do the Friday indicator rundown. Some of these indicators may appear simple-minded, but together they do seem to indicate market conditions. For review, here’s the Friday/Monday update (on 20 December 2021). This post was 8 sessions before the top of the current, Bear Market/Pullback:
Friday there were 5 bull indicators:
-The smoothed advancing volume on the NYSE is rising.
-The 10-dMA % of issues advancing on the NYSE (Breadth) is above 50%.
-My Money Trend indicator is climbing.
-Short-term new-high/new-low data is rising.
-The 5-10-20 Timer System is BUY; the 5-dEMA and 10-dEMA are both ABOVE the 20-dEMA.
 
Today [Monday, 20 December 2021], none of those indicators are bullish. It looks like today’s count would be 21 bear and zero bull.  That’s the worst count since I started keeping these numbers a couple years ago.” As you might imagine, I reduced stock holdings 20 December 2021. Enough about the past...
 
Here’s this week’s Friday review:
The Friday rundown of indicators was a little more bearish than last week (now 11-bear and 9-bull), but not far from neutral. (These indicators tend to be both long-term and short-term, so they are different than the 20 that I report on daily.) 
 
BULL SIGNS
-The smoothed advancing volume on the NYSE is falling.
-The 50-dMA percentage of issues advancing on the NYSE (Breadth) is above 50%.
-The 100-dMA percentage of issues advancing on the NYSE (Breadth) is above 50%.
-Long-term new-high/new-low data.
-The long-term, 50-dEMA, Fosback Hi-Low Logic Index is bullish.
-On average, the size of up-moves has been larger than the size of down-moves over the last month.
-90% up-volume days - the last one was 31 Jan. and before that, 30 November.  That’s pretty far apart, but I’ll still put this in the bullish column. We have not seen a 90% down-volume day since the 2 up-volume days.
-XLI-ETF (Cyclical Industrials) is outperforming the S&P 500. The Long-term value is turning down sharply, but the short-term value is up today.  Let’s call it Bullish.
-S&P 500 is outperforming Utilities (XLU-ETF).
 
NEUTRAL
-Bollinger Bands. (Very close to bullish.)
-RSI (Very close to bullish.)
-Issues advancing on the NYSE (Breadth) compared to the S&P 500. – Very close to a bullish indication.
-There was a Distribution Day 9 & 21 Feb, however, it’s only 2 since the last Follow-thru day.
-There have only been 2 Statistically-Significant days (big moves in price-volume) in the last 15-days.
-Sentiment.
-The short-term, 10-dayEMA, Fosback Hi-Low Logic Index is neutral.
-Overbought/Oversold Index (Advance/Decline Ratio). 
-There was a Zweig Breadth Thrust 12 January. That’s a rare, very-bullish sign. - Expired
-There have been 4 up-days over the last 10 sessions – neutral.
-There have been 9 up-days over the last 20 sessions - neutral.
-The graph of the 100-day Count (the 100-day sum of up-days) is flat.
-The 50-dMA percentage of issues advancing on the NYSE (Breadth) has been above 50%, for 3 days in a row ending the “correction-now” signal.
-The Calm-before-the-Storm/Panic Indicator flashed a panic-buying signal 10 November - expired.
-VIX indicator.
-The S&P 500 is 0.8% above its 200-dMA. (Bear indicator is 12% above the 200-day.)
-There was a Hindenburg Omen signal 8 April 2022 – expired.
-2.8% of all issues traded on the NYSE made new, 52-week highs when the S&P 500 made a new all-time-high, 3 January 2022. (There is no bullish signal for this indicator.) This indicated that the advance was too narrow and a correction was likely to be >10%. It proved correct, but is now Expired
-The 52-week, New-high/new-low ratio improved by 3.5 standard deviations. More simply, the spread between new-highs and new-lows improved by 716 on 14 October. That’s a solid bottom sign at a retest. – Expired.
-13 & 21 Oct were Bullish Outside Reversal Days with no Bearish Outside Reversal days since then - expired.
-46% of the 15-ETFs that I track have been up over the last 10-days. Neutral.
 
BEAR SIGNS
-The 10-dMA percentage of issues advancing on the NYSE (Breadth) is below 50%.
-MACD of the percentage of issues advancing on the NYSE (breadth) made a bearish crossover 6 Feb.
-Smoothed Buying Pressure minus Selling Pressure is falling.
-MACD of S&P 500 price made a bearish crossover 10 Feb.
-My Money Trend indicator is falling.
-Short-term new-high/new-low data.
-McClellan Oscillator.
-Slope of the 40-dMA of New-highs is falling.
-The Smart Money (late-day action) is bearish.
-The 5-10-20 Timer System is SELL; the 5-dEMA and 10-dEMA are both below the 20-dEMA.
-The 5-day EMA is below the 10-day EMA so short-term momentum is bearish.
 
On Friday, 21 February, 2 days after the top before the Coronavirus pullback, there were 10 bear-signs and 1 bull-sign. Now there are 11 bear-signs and 9-Bull. Last week, there were 10 bear-sign and 13 bull-signs.
 
The Friday rundown is slightly bearish, but remains a near neutral indication. 
 
Today, the daily spread of 20 Indicators (Bulls minus Bears) improved from -2 to zero (a positive number is bullish; negatives are bearish); the 10-day smoothed sum that smooths the daily fluctuations declined from +8 to +6. (The trend direction is more important than the actual number for the 10-day value.) These numbers sometimes change after I post the blog based on data that comes in late. Most of these 20 indicators are short-term so they tend to bounce around a lot.
 
LONG-TERM INDICATOR: The Long Term NTSM indicator remained HOLD: PRICE is positive; VIX & SENTIMENT are neutral.  VOLUME was negative.
 
(The important BUY in this indicator was on 21 October, 7-days after the bottom. For my NTSM overall signal, I suggested that a short-term buying opportunity occurred on 27 September (based on improved market internals on the retest), although without market follow-thru, I was unwilling to call a buy; however, I did close shorts and increased stock holdings. I issued a Buy-Signal on 4 October, 6-days before the final bottom, based on stronger market action that confirmed the market internals signal.)
 
Bottom line: I remain a BULL, although somewhat more cautious.
 
ETF - MOMENTUM ANALYSIS:
TODAY’S RANKING OF 15 ETFs (Ranked Daily)
ETF ranking follows:

The top ranked ETF receives 100%. The rest are then ranked based on their momentum relative to the leading ETF.
*For additional background on the ETF ranking system see NTSM Page at…
http://navigatethestockmarket.blogspot.com/p/exchange-traded-funds-etf-ranking.html
 
BEST DOW STOCKS - TODAY’S MOMENTUM RANKING OF THE DOW 30 STOCKS (Ranked Daily)
DOW 30 momentum ranking follows:

The top ranked Stock receives 100%. The rest are then ranked based on their momentum relative to the leading Stock.
For more details, see NTSM Page at…
https://navigatethestockmarket.blogspot.com/p/a-system-for-trading-dow-30-stocks-my_8.html
 
FRIDAY MARKET INTERNALS (NYSE DATA)
My basket of Market Internals improved to HOLD.
(Market Internals are a decent trend-following analysis of current market action, but should not be used alone for short term trading. They are most useful when they diverge from the Index.) 
 
 
...My current invested position is about 70% stocks, including stock mutual funds and ETFs. I’m usually about 50% invested in stocks.
 
I trade about 15-20% of the total portfolio using the momentum-based analysis I provide here. If I can see a definitive bottom, I’ll add a lot more stocks to the portfolio using an S&P 500 ETF.
 

Thursday, February 23, 2023

GDP ... Jobless Claims ... Crude Inventories ... Momentum Trading DOW Stocks & ETFs … Stock Market Analysis ...

 
“Trade what you see; not what you think.” – The Old Fool, Richard McCranie, trader extraordinaire.
 
JOBLESS CLAIMS (Bloomberg)
US claims for unemployment benefits unexpectedly fell to the lowest in three weeks, signaling unrelenting tightness in the labor market. Initial unemployment claims decreased by 3,000 to 192,000...” Story at...
https://www.bloomberg.com/news/articles/2023-02-23/us-unemployment-claims-drop-to-lowest-level-in-four-weeks
 
GDP (CNN)
“The US economy grew at a 2.7% annual rate in the final three months of the year, the Commerce Department reported Thursday. That’s less than the previous estimate of 2.9% growth in the quarter.” Story at...
https://www.cnn.com/2023/02/23/economy/gdp-revision-us-economy/index.html\
 
CRUDE OIL INVENTORIES (EIA)
“U.S. commercial crude oil inventories (excluding those in the Strategic Petroleum Reserve) increased by 7.6 million barrels from the previous week. At 479.0 million barrels, U.S. crude oil inventories are about 9% above the five year average for this time of year.” Report at...
https://ir.eia.gov/wpsr/wpsrsummary.pdf
 
MARKET REPORT / ANALYSIS
-Thursday the S&P 500 rose about 0.5% to 4012.
-VIX slipped about 5% to 21.14.
-The yield on the 10-year Treasury dipped to 3.885%.
 
PULLBACK DATA:
-Drop from Top: 16.3% as of today. 25.4% max (on a closing basis).
-Trading Days since Top: 283-days.
The S&P 500 is 1.8% ABOVE its 200-dMA & 0.8% ABOVE its 50-dMA.
*I won’t call the correction over until the S&P 500 makes a new-high; however, evidence suggests the bottom was in the 3600 area.
 
MY TRADING POSITIONS:
XLK – Technology ETF.
XLE – Energy Sector ETF. It hasn’t been doing much recently, but Russia is cutting production and that should help the sector.  We have a good dividend in the meantime.
BA – (Boeing) I am late on this one, but we’ll see.
XLY - Consumer Discretionary ETF.
 
SHY – Short term bonds. 30-day yield is 4.2%. (Trailing 1-year yield is 1.3%.) I’ll hold this, but if the market retests the lows, I’ll sell it and buy stocks.)
 
TODAY’S COMMENT:
When I plugged in the lows for the day, we note that both Bollinger Bands and RSI were oversold around mid-day, a pretty good short-term buy signal.  The Index dropped to near the 200-dMA and bounced higher, so intra-day, the signal was to buy. All of my work is based on closing data and the close was a lot higher and neither RSI or Bollinger Bands were oversold at the close; it’s hard to know if buying mid-day would have been the right call or not.
 
Buying exactly at a low is not usually possible, and if mid-day Thursday was the low for this small retreat, I missed it. I’ll watch tomorrow.  If we see reasonably strong buying, I’ll add to stock holdings with leveraged positions. A down-day may suggest a little more watching to see if the Index will close below the 50-dMA.
 
I am still bullish, so this is all about trying to avoid buying a leveraged position only to have it fall sharply for a few days after the buy.
 
The S&P 500 is outpacing the Utilities ETF (XLU) by a lot.  That’s bullish - If investors were worried about a stock market collapse, they would buy XLU.
 
Today, the daily spread of 20 Indicators (Bulls minus Bears) remained -2 (a positive number is bullish; negatives are bearish); the 10-day smoothed sum that smooths the daily fluctuations declined from +19 to +8. (The trend direction is more important than the actual number for the 10-day value.) These numbers sometimes change after I post the blog based on data that comes in late. Most of these 20 indicators are short-term so they tend to bounce around a lot.
 
LONG-TERM INDICATOR: The Long Term NTSM indicator remained HOLD: PRICE is positive; VIX & SENTIMENT are neutral.  VOLUME was negative.
 
(The important BUY in this indicator was on 21 October, 7-days after the bottom. For my NTSM overall signal, I suggested that a short-term buying opportunity occurred on 27 September (based on improved market internals on the retest), although without market follow-thru, I was unwilling to call a buy; however, I did close shorts and increased stock holdings. I issued a Buy-Signal on 4 October, 6-days before the final bottom, based on stronger market action that confirmed the market internals signal.)
 
Bottom line: I’m remain a BULL, although somewhat more cautious.
 
BEST ETFs - MOMENTUM ANALYSIS:
TODAY’S RANKING OF 15 ETFs (Ranked Daily)
ETF ranking follows:

The top ranked ETF receives 100%. The rest are then ranked based on their momentum relative to the leading ETF.
*For additional background on the ETF ranking system see NTSM Page at…
http://navigatethestockmarket.blogspot.com/p/exchange-traded-funds-etf-ranking.html
 
BEST DOW STOCKS - TODAY’S MOMENTUM RANKING OF THE DOW 30 STOCKS (Ranked Daily)
DOW 30 momentum ranking follows:

The top ranked Stock receives 100%. The rest are then ranked based on their momentum relative to the leading Stock.
For more details, see NTSM Page at…
https://navigatethestockmarket.blogspot.com/p/a-system-for-trading-dow-30-stocks-my_8.html
 
THURSDAY MARKET INTERNALS (NYSE DATA)
My basket of Market Internals remained SELL.
(Market Internals are a decent trend-following analysis of current market action, but should not be used alone for short term trading. They are most useful when they diverge from the Index.) 
 
 
...My current invested position is about 65% stocks, including stock mutual funds and ETFs. I’m usually about 50% invested in stocks.
 
I trade about 15-20% of the total portfolio using the momentum-based analysis I provide here. If I can see a definitive bottom, I’ll add a lot more stocks to the portfolio using an S&P 500 ETF.


Wednesday, February 22, 2023

FED Minutes ... EIA Crude Inventories ... Momentum Trading DOW Stocks & ETFs … Stock Market Analysis ...

“Trade what you see; not what you think.” – The Old Fool, Richard McCranie, trader extraordinaire.
 
FOMC MINUTES (FED Minutes)
“’Federal Reserve officials saw that slowing inflation could support a peak in the federal-funds rate this year...’Almost all participants agreed that it was appropriate to raise the target range for the federal-funds rate 25 basis points at this meeting,’ the minutes read. ‘Many of these participants observed that a further slowing in the pace of rate increases would better allow them to assess the economy’s progress toward the Committee’s goals of maximum employment and price stability.’
“A few” participants favored a 0.50 percentage point increase on Feb. 1, according to the minutes.” Story at...
https://www.barrons.com/articles/fed-meeting-minutes-release-today-b19c6099
 
EIA CRUDE INVENTORIES (EIA)
“U.S. commercial crude oil inventories (excluding those in the Strategic Petroleum Reserve) increased by 16.3 million barrels from the previous week. At 471.4 million barrels, U.S. crude oil inventories are about 8% above the five-year average for this time of year.” Report at...
https://ir.eia.gov/wpsr/wpsrsummary.pdf
 
MARKET REPORT / ANALYSIS
-Wednesday the S&P 500 fell about 0.2% to 3991.
-VIX slipped about 3% to 22.29. (The Options Crowd may think the decline is over.)
-The yield on the 10-year Treasury dipped to 3.925%.
 
PULLBACK DATA:
-Drop from Top: 16.8% as of today. 25.4% max (on a closing basis).
-Trading Days since Top: 283-days.
The S&P 500 is 1.3% ABOVE its 200-dMA & 0.3% ABOVE its 50-dMA.
*I won’t call the correction over until the S&P 500 makes a new-high; however, evidence suggests the bottom was in the 3600 area.
 
MY TRADING POSITIONS:
XLK – Technology ETF.
XLE – Energy Sector ETF. It hasn’t been doing much recently, but Russia is cutting production and that should help the sector.  We have a good dividend in the meantime.
BA – (Boeing) I am late on this one, but we’ll see.
XLY - Consumer Discretionary ETF.
 
SHY – Short term bonds. 30-day yield is 4.2%. (Trailing 1-year yield is 1.3%.) I’ll hold this, but if the market retests the lows, I’ll sell it and buy stocks.)
 
TODAY’S COMMENT:
Today’s drop in the S&P 500 was pretty closely aligned with the release of the FED minutes at 2PM.  I am not sure that the news deserved the reaction. Fed member Bullard has been giving speeches that he wanted to raise rates faster, but that’s nothing new and he’s not currently a voting member.
 
At least there was a bounce at the end of the day. 
 
I still don’t see signs that the decline is over. That’s not especially unusual since short term declines don’t aways send actionable signals. Today could have been a short-term bottom. The S&P 500 is only 0.3% above its 50-dMA and that may be close enough. We’ll see.  
 
I’ll reset my leveraged positions (SSO & QLD) if the Index breaks its 50-dMA or if I see other bull signs. Depending on market action I may buy back tomorrow. Market internals were leaning bullish Tuesday, but not by much.
 
Today, the daily spread of 20 Indicators (Bulls minus Bears) remained -2 (a positive number is bullish; negatives are bearish); the 10-day smoothed sum that smooths the daily fluctuations declined from +29 to +19. (The trend direction is more important than the actual number for the 10-day value.) These numbers sometimes change after I post the blog based on data that comes in late. Most of these 20 indicators are short-term so they tend to bounce around a lot.
 
LONG-TERM INDICATOR: The Long Term NTSM indicator remained HOLD: PRICE is positive; VIX & SENTIMENT are neutral.  VOLUME was negative.
 
(The important BUY in this indicator was on 21 October, 7-days after the bottom. For my NTSM overall signal, I suggested that a short-term buying opportunity occurred on 27 September (based on improved market internals on the retest), although without market follow-thru, I was unwilling to call a buy; however, I did close shorts and increased stock holdings. I issued a Buy-Signal on 4 October, 6-days before the final bottom, based on stronger market action that confirmed the market internals signal.)
 
Bottom line: I’m remain a BULL, although somewhat more cautious.
 
BEST ETFs - MOMENTUM ANALYSIS:
TODAY’S RANKING OF 15 ETFs (Ranked Daily)
ETF ranking follows:

The top ranked ETF receives 100%. The rest are then ranked based on their momentum relative to the leading ETF.
*For additional background on the ETF ranking system see NTSM Page at…
http://navigatethestockmarket.blogspot.com/p/exchange-traded-funds-etf-ranking.html
 
BEST DOW STOCKS - TODAY’S MOMENTUM RANKING OF THE DOW 30 STOCKS (Ranked Daily)
DOW 30 momentum ranking follows:

The top ranked Stock receives 100%. The rest are then ranked based on their momentum relative to the leading Stock.
For more details, see NTSM Page at…
https://navigatethestockmarket.blogspot.com/p/a-system-for-trading-dow-30-stocks-my_8.html
 
WEDNESDAY MARKET INTERNALS (NYSE DATA)
My basket of Market Internals remained SELL.
(Market Internals are a decent trend-following analysis of current market action, but should not be used alone for short term trading. They are most useful when they diverge from the Index.) 
 
 
...My current invested position is about 65% stocks, including stock mutual funds and ETFs. I’m usually about 50% invested in stocks.
 
I trade about 15-20% of the total portfolio using the momentum-based analysis I provide here. If I can see a definitive bottom, I’ll add a lot more stocks to the portfolio using an S&P 500 ETF.


Tuesday, February 21, 2023

Markit PMI ... Home Sales ... Momentum Trading DOW Stocks & ETFs … Stock Market Analysis ...

 “Trade what you see; not what you think.” – The Old Fool, Richard McCranie, trader extraordinaire.
 
“...we recently discussed the release of the results of interviews with over 75 media leaders by former executive editor for The Washington Post Leonard Downie Jr. and former CBS News President Andrew Heyward. They concluded that objectivity is now considered reactionary and even harmful. Emilio Garcia-Ruiz, editor-in-chief at the San Francisco Chronicle said it plainly: “Objectivity has got to go.” – Jonathan Turley. Turley holds the Shapiro Chair for Public Interest Law at The George Washington University Law School, where he teaches tortscriminal procedure, and constitutional law. Commentary at...
https://jonathanturley.org/2023/02/18/gallup-fifty-percent-of-american-believe-media-lies-to-promote-agenda/#more-200788
 
“DeSantis is a RINO who is trying to hide his past. I don’t read the New York Post anymore. It has become Fake News, just like Fox & WSJ!” – Former President Donald Trump.
My cmt: The right-wing news media is now “fake news”?
 
IHS MARKIT COMPOSITE PMI (S&P Global)
“February data signalled a stabilisation in the US private sector economy, according to latest ‘flash’ PMI™ data from S&P Global. Business activity rose fractionally when compared with January. The upturn in the headline figure was driven by the services sector, as manufacturers continued to indicate a fall in production. The headline Flash US PMI Composite Output Index registered 50.2 in February, up sharply from 46.8 in January. The latest reading was the highest for eight months and signalled broadly unchanged output on the month across the private sector. Service sector firms registered a fractional uptick in business activity while manufacturers reported a slower decrease in output.” Press release at...
https://www.pmi.spglobal.com/Public/Home/PressRelease/1a48b2fdf6114741aade2fd71f25f4a6
 
EXISTING HOME SALES (YahooNews)
“U.S. existing home sales dropped to the lowest level in more than 12 years in January, but the pace of decline slowed, raising cautious optimism that the housing market slump could be close to reaching a bottom. The report from the National Association of Realtors on Tuesday also showed the smallest increase in annual house prices since 2012...” Story at...
https://finance.yahoo.com/news/u-existing-home-sales-fall-150228036.html
 
2 YEAR & FED FUNDS IN HARMONY (Heritage Capital)
“While the 2-Year has bounced this month it is currently sitting right on the Fed Funds Rate, meaning temporary perfect equilibrium. The next thing to watch for is when the 2-Year hits 4%. That will confirm the rate hike cycle is officially and firmly over...Stocks are hanging in and will likely revisit last week’s lows shortly. I wrote about the moderation of the rally a few weeks ago when Goldman Sachs’ David Kostin went from bear to bull right at February highs. Funny how often that happens with high profile pundits. So far, none of the major indices have done anything wrong to indicate something deeper. This just looks like a routine stock market pullback.” Commentary at...
https://investfortomorrow.com/blog/2-year-fed-funds-in-harmony-today/
 
MARKET REPORT / ANALYSIS
-Tuesday the S&P 500 fell about 2% to 3997.
-VIX rose about 14% to 22.87.
-The yield on the 10-year Treasury rose to 3.955%.
 
PULLBACK DATA:
-Drop from Top: 13.5% as of today. 25.4% max (on a closing basis).
-Trading Days since Top: 283-days.
The S&P 500 is 1.4% ABOVE its 200-dMA & 0.5% ABOVE its 50-dMA.
*I won’t call the correction over until the S&P 500 makes a new-high; however, evidence suggests the bottom was in the 3600 area.
 
MY TRADING POSITIONS:
XLK – Technology ETF.
XLE – Energy Sector ETF. It hasn’t been doing much recently, but Russia is cutting production and that should help the sector.  We have a good dividend in the meantime.
BA – (Boeing) I am late on this one, but we’ll see.
XLY - Consumer Discretionary ETF.
 
SHY – Short term bonds. 30-day yield is 4.2%. (Trailing 1-year yield is 1.3%.) I’ll hold this, but if the market retests the lows, I’ll sell it and buy stocks.)
 
TODAY’S COMMENT:
My system is built to try to call the big turning points in the markets.  That said, I do have a fair number of indicators that tend to follow short-term trends. We look at them for short-term signs, but with a warning that short-term timing is usually a loser’s game.
 
When I look for signs that this weakness is ending, I don’t see too many.  Bollinger Bands are close to a buy signal; RSI is not. The number of up-days over the last 10 and 20 days are 8 and 9 respectively, so they aren’t saying buy yet. Our statistical signals, especially Variance, did not jump up today (that would suggest panic selling) so we don’t have a buy signal there either.
 
The only buy-signals in the “Top-Bottom” ensemble are the Fosback long and short-term Logic Indicators; they have both been sending buy-signals since late January. Neither of these indicators are going to be good for a short-term call since they are based on new-high/new-low data that is typically slow to turn.
 
Today could have been a short-term bottom, but it appears that the S&P 500 could drop a bit further before we see a turn-around. I suspect the Index may break its 50-day moving average (50-dMA) now about 3980. The 200-dMA is about 3940.  I doubt that the index will break that level.
 
I’ll reset my leveraged positions (SSO & QLD) if the Index breaks its 50-dMA or if I see other bull signs.
 
Today, the daily spread of 20 Indicators (Bulls minus Bears) declined from zero to -2 (a positive number is bullish; negatives are bearish); the 10-day smoothed sum that smooths the daily fluctuations declined from +38 to +29. (The trend direction is more important than the actual number for the 10-day value.) These numbers sometimes change after I post the blog based on data that comes in late. Most of these 20 indicators are short-term so they tend to bounce around a lot.
 
LONG-TERM INDICATOR: The Long Term NTSM indicator remained HOLD: PRICE is positive; VIX & SENTIMENT are neutral.  VOLUME was actually negative.
 
(The important BUY in this indicator was on 21 October, 7-days after the bottom. For my NTSM overall signal, I suggested that a short-term buying opportunity occurred on 27 September (based on improved market internals on the retest), although without market follow-thru, I was unwilling to call a buy; however, I did close shorts and increased stock holdings. I issued a Buy-Signal on 4 October, 6-days before the final bottom, based on stronger market action that confirmed the market internals signal.)
 
Bottom line: I’m remain a BULL, although somewhat more cautious.
 
BEST ETFs - MOMENTUM ANALYSIS:
TODAY’S RANKING OF 15 ETFs (Ranked Daily)
ETF ranking follows:

The top ranked ETF receives 100%. The rest are then ranked based on their momentum relative to the leading ETF.
*For additional background on the ETF ranking system see NTSM Page at…
http://navigatethestockmarket.blogspot.com/p/exchange-traded-funds-etf-ranking.html

BEST DOW STOCKS - TODAY’S MOMENTUM RANKING OF THE DOW 30 STOCKS (Ranked Daily)
DOW 30 momentum ranking follows:

The top ranked Stock receives 100%. The rest are then ranked based on their momentum relative to the leading Stock.
For more details, see NTSM Page at…
https://navigatethestockmarket.blogspot.com/p/a-system-for-trading-dow-30-stocks-my_8.html

TUESDAY MARKET INTERNALS (NYSE DATA)
My basket of Market Internals remained SELL.
(Market Internals are a decent trend-following analysis of current market action, but should not be used alone for short term trading. They are most useful when they diverge from the Index.) 
 
 
...My current invested position is about 65% stocks, including stock mutual funds and ETFs. I’m usually about 50% invested in stocks.
 
I trade about 15-20% of the total portfolio using the momentum-based analysis I provide here. If I can see a definitive bottom, I’ll add a lot more stocks to the portfolio using an S&P 500 ETF.