“Trade what you see; not what you think.” – The Old Fool,
Richard McCranie, trader extraordinaire.
“The big money is not in the buying and selling. But in
the waiting.” - Charlie Munger, Vice Chairman, Berkshire Hathaway
“In my decades of investing experience, I have not seen
such mindless and uninformed speculation as I have witnessed
recently. Indeed, in nominal dollar terms...it is far in excess of the
dot.com boom.” – Doug Cass.
“I never imagined that I would see the day that the
Chairman of the House Judiciary Committee would step forward to call for raw
court packing. It is a sign of our current political environment where rage
overwhelms reason.” - Professor Jonathan Turley, honorary Doctorate of Law from
John Marshall Law School for his contributions to civil liberties and the public
interest.
“...lots of Democrats will say that we have to listen to everybody
and we have to include every perspective, or that we don’t have
to run a ruthless messaging campaign. Well, you kinda do. It really matters.” – James Carville, Democratic Political Consultant.
PERSONAL SPENDING / PERSONAL INCOME (The Hill)
“Consumer spending and personal income rose sharply in
March, according to
data released Friday by the Commerce Department, driven in part
by President Biden’s
$1.9 trillion economic relief bill. Personal income rose a staggering 21.1
percent in March after falling 7 percent in February, thanks in part to a third
round of direct payments...” Story at...
PCE PRICES (CNBC)
“The PCE Price Index rose 0.5%, while the core PCE Index,
which excludes food and energy, rose 0.4% in the month. Economists surveyed by
Dow Jones had penciled in a 0.3% rise for the core index.” Story at...
https://www.cnbc.com/2021/04/30/us-bonds-treasury-yields-mixed-following-strong-gdp-data.html
EMPLOYMENT COST INDEX (Reuters)
“...the Labor Department said its Employment Cost Index,
the broadest measure of labor costs, jumped 0.9% in the first quarter. That was
the largest rise since the second quarter of 2007... Wages in the accommodation
and food services industry, hardest hit by the pandemic, soared 1.7%.” Story at...
CHICAGO PMI (Advisor Perspectives)
“The Chicago Business BarometerTM, produced with MNI,
rose to 72.1 in April, the highest level since December 1983. The index gained
5.7 points, boosted by an influx of new business.” Analysis at...
CORONAVIRUS (NTSM)
Here’s the latest from the COVID19 Johns Hopkins website as
of 5:30pm Friday. US total case numbers are on the left axis; daily numbers are
on the right side of the graph with the 10-dMA of daily numbers in Green.

MARKET REPORT / ANALYSIS
-Friday the S&P 500 dropped
about 0.7% to 4181.
-VIX rose about 6% to 18.61.
-The yield on the 10-year
Treasury slipped to 1.625%.
Amazon, Apple and Microsoft
all reported strong earnings and all have slipped after reporting. They were
all down today. When good news is met with a bad result, it is usually a bad
sign.
Now CNBC pundits are talking
pullback – we’ll see.
Here’s Friday’s run-down of some important indicators.
These tend to be both long-term and short-term, so they are somewhat different
than the 20 that I report on daily.
BULL SIGNS
-The 10-dMA of issues advancing on the NYSE
(Breadth) is above 50%
-The 50-dMA % of issues advancing on the NYSE (Breadth)
is above 50%.
-The 100-dMA of the % of issues advancing on the
NYSE (Breadth) is above 50%.
-VIX is falling sharply - bullish.
-The 5-10-20 Timer System is BUY; the 5-dEMA and 10-dEMA are
both above the 20-dEMA.
-The size of up-moves has been larger than the size of
down-moves over the last month.
-Cyclical Industrials (XLI-ETF) are out-performing the S&P
500 but the rate of change is flat. (It may go up or down from here.)
-Long-term new-high/new-low data is rising.
-MACD of the percentage of issues advancing on the NYSE
(breadth) made a bullish crossover 30 Apr.
-Slope of the 40-dMA of New-highs is rising, but not by
much.
NEUTRAL
-Overbought/Oversold Index (Advance/Decline Ratio).
-Bollinger Bands.
-RSI.
-The market has broadened out; 13.4% of all issues
traded on the NYSE made new, 52-week highs when the S&P 500 made a new
all-time-high 29 Apr. (there is no bullish signal for this indicator.)
Currently, the value is above average and suggests that if we do have a
correction from here it would likely be less than 10%.
-Distribution warnings. There have been 3 Distribution
Days in the last 8 days, including today; it would take 6 Distribution Days
over 3 weeks or less to give a sell signal.
-Non-crash Sentiment indicator remains neutral, but it is
too bullish and that means it is leaning bearish.
-My Money Trend indicator.
-Short-term new-high/new-low data is flat.
-The Fosback High-Low Logic Index is neutral.
-There have been 4 up-days over the last 10-days.
Neutral.
-There have been 11 up-days over the last 20 days.
Neutral
-Statistically, the S&P 500 gave a panic-signal, 27
January. The signal has expired.
-8 Mar, the 52-week, New-high/new-low ratio improved by 3.5
standard deviations very bullish, but the signal has expired.
-There have been 4 Statistically-Significant days in the
last 15-days. This signal can be Bearish or Bullish, but it takes 5 to give a
signal.
BEAR SIGNS
-McClellan Oscillator is bearish.
-The smoothed advancing volume on the NYSE is falling.
-The S&P 500 is under-performing Utilities ETF (XLU).
-MACD of S&P 500 price made a bearish crossover 22
Apr.
-The Smart Money (late-day action) is now headed down. (This
indicator is based on the Smart Money Indicator developed by Don Hayes).
-The S&P 500 is 14.4% above its 200-dMA (Sell point
is 12%.); when Sentiment is considered, the signal is also bearish. This value
was 15.9% above the 200-dMA when the 10% correction occurred in Sep 2020.
-Breadth on the NYSE compared to the S&P 500 index is
bearish – the Index is too far ahead of stocks advancing on the NYSE.
-46% of the 15-ETFs that I track have been up over the
last 10-days.
On Friday, 21 February, 2 days after the top of the Coronavirus
pullback, there were 10 bear-signs and 1 bull-sign. Now there are 8 bear-signs
and 10 bull-signs. Last week, there were 8 bear-signs and 10 bull-signs.
The Bull-signs outnumbered the
Bear-signs, but all is not well. Top
Indicators that are currently warning: (1) The Index is too far above its
200-dMA; (2) the Index is too far ahead of breadth; (3) and the Index is too
far ahead of Money Trend.
These are not enough top
indicators to call a top, but markets remain stretched.
The daily sum of 20 Indicators
improved declined from +7 to -3 (a positive number is bullish; negatives are bearish);
the 10-day smoothed sum that smooths the daily fluctuations improved declined from +21
to +14 (These numbers sometimes change after I post the blog based on data that
comes in late.) Most of these indicators are short-term and many are trend
following.
The Long Term NTSM indicator
ensemble remained BUY. Price & VIX are bullish; Volume & Sentiment are
neutral. This indicator can be slow to turn.
I guess I’ll repeat my earlier comment: “We are getting
close to a pullback of some kind.” The
timing is still a guessing game.”
MOMENTUM ANALYSIS:
TODAY’S RANKING OF 15 ETFs
(Ranked Daily)
The top ranked ETF receives
100%. The rest are then ranked based on their momentum relative to the leading
ETF.

*For additional background on
the ETF ranking system see NTSM Page at…
http://navigatethestockmarket.blogspot.com/p/exchange-traded-funds-etf-ranking.html
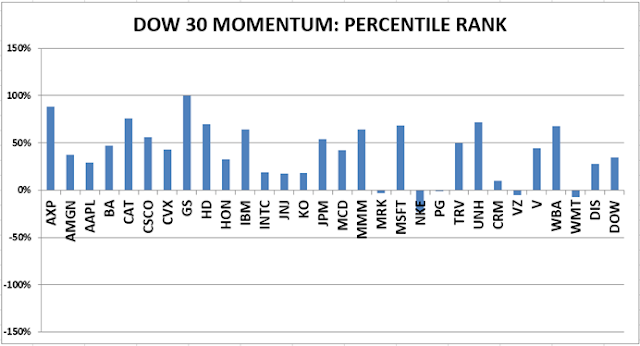
TODAY’S RANKING OF THE DOW 30
STOCKS (Ranked Daily)
Here’s the revised DOW 30 and
its momentum analysis. The top ranked stock receives 100%. The rest are then
ranked based on their momentum relative to the leading stock.

For more details, see NTSM
Page at…
https://navigatethestockmarket.blogspot.com/p/a-system-for-trading-dow-30-stocks-my_8.html
FRIDAY MARKET INTERNALS (NYSE DATA)
Market Internals fell to NEUTRAL on the market.

Market Internals are a decent trend-following
analysis of current market action, but should not be used alone for short term
trading. They are usually right, but they are often late. They are most useful when they diverge from
the Index.
Using the Short-term indicator
in 2018 in SPY would have made a 5% gain instead of a 6% loss for buy-and-hold.
The methodology was Buy on a POSITIVE indication and Sell on a NEGATIVE
indication and stay out until the next POSITIVE indication. The back-test
included 13-buys and 13-sells, or a trade every 2-weeks on average.

As of 19 April, my stock-allocation
is about 40% invested in stocks. I hadn’t intended to drop this low, but I took
profits in both Boeing and Intel due to their dropping out of the top 3 in
momentum. I’ll move back in when conditions appear more favorable.
You may wish to have a higher
or lower % invested in stocks depending on your risk tolerance. 50% is a
conservative position that I consider fully invested for most retirees. As a
retiree, 50% in the stock market is about fully invested for me – it is a
cautious and conservative number. If I feel very confident, I might go to 60%;
if a correction is deep enough, and I can call a bottom, 80% would not be out
of the question.
The markets have not
retested the lows on recent corrections and that left me under-invested on the
bounces. I will need to put less reliance on retests in the future.