“Trade what you see; not what you think.” – The Old Fool,
Richard McCranie, trader extraordinaire.
LOOKOUT – JANE FONDA SENT ME ON ANOTHER GLOBAL WARMING
RANT!
“We’ve got about seven, eight years to cut ourselves in half
of what we use of fossil fuels, and unfortunately, the people that have the
least responsibility for it are hit the hardest ...We have to arrest and jail
those men — they’re all men [behind this]... White men are the things that
matter, and then everything else [is] at the bottom.... There’d be no climate
crisis if it wasn’t for racism.” – Jane Fonda
...Jane Fonda has apologized numerous times for
the actions that earned her the nickname “Hanoi Jane” during
the Vietnam War.
Maybe if she lives another 50-years she’ll apologize for her Global-Warming-lunacy.
My cmt: The Earth’s temperature has risen 1 degree
centigrade in the last 100 years. It doesn’t
seem likely that we have only 7 or 8 years to cut fossil fuel use in half, especially
since we are hearing this from global know-it-all, Jane Fonda.
If Global Warming is an existential threat, it can be
easily reversed by increasing the Earth’s albedo. “It appears that
stratospheric aerosol injection, at a moderate intensity, could counter most
changes to temperature and precipitation, take effect rapidly, have low direct
implementation costs, and be reversible in its direct climatic effects.” - Climate
Intervention: Reflecting Sunlight to Cool Earth. Washington, D.C.: National Academies Press.
I expect my Grandchildren will not have to worry about
man-made climate change. If the promise of safe, cheap energy from nuclear
fusion is borne out, we’ll be able to reverse global warming attributable to
CO2 in the relatively near future. Technologies now exist to remove CO2 from
the atmosphere. Unfortunately, that won’t stop non-manmade global warming – the
last Ice Age was 12,000 years ago and the Earth has been warming since then – Sorry
Greta, sea-level rise will continue.
And BTW, climate change is not causing fires in Canada.
If increased temperatures were the cause of fires, wouldn’t we be having more
forest fires where it is warmer than Canada – say, southern forests in the
Virginias, Tennessee, Georgia, etc.? As stated in “Unsettled – What Climate
Science Tells us, What it Doesn’t, and Why it Matters” by Steven Koonin,
PhD, the actual numbers show fewer fires in more recent decades, not more. (Remember, climate is defined in 30-year
slices by the IPCC. These one-year events are weather – not climate.) Man-made,
Global warming is real, but I get very tired of every anomaly being blamed on
Global Warming. (The latest was mountain landslides, but I’ll save that one for
another rant.)
My apologies to those who wanted to read a Financial
Blog.
PERSONAL INCOME (Advisor Perspectives)
“Personal income (excluding transfer receipts) rose 0.4% in May
and is up 5.5% year-over-year. However, when adjusted for inflation using the BEA's PCE
Price Index, real personal income (excluding transfer receipts) was up 0.3%
month-over-month and 1.6% year-over-year...” [It is believed
that the NBER Bases its recession decisions on the Big Four: Retail sales, Industrial
production, Employment and Real income] Here is a percent-off-high
chart based on an average of the big four. The average set a new all-time high
in November of 2018 [recessions in grey].”
Chart and analysis at
https://www.advisorperspectives.com/dshort/updates/2023/06/30/personal-income-big-four-economic-indicators-rises-may?topic=covid-19-coronavirus-coverage
PCE PRICES / / PERSONAL SPENDING (Reuters)
“U.S. consumer spending fizzled in May as households cut
back on purchases of new light trucks and other long-lasting manufactured goods
amid higher borrowing costs, suggesting the economy lost some speed in the
second quarter...underlying price pressures remained too strong to discourage
the Federal Reserve from returning to its strategy of raising interest rates in
July, economists said... Excluding the volatile food and energy components, the
PCE price index climbed 0.3% after rising 0.4% in the prior month. The
so-called core PCE price index increased 4.6% on a year-on-year basis in May
after advancing 4.7% in April.
https://www.reuters.com/markets/us/us-consumer-spending-edges-up-may-inflation-still-high-2023-06-30/
MARKET REPORT / ANALYSIS
-Friday the S&P 500 rose about 1.2% to 4450.
-VIX rose about 0.4% to 13.59. (The Options
Players may not be so sanguine about the rally.)
-The yield on the 10-year Treasury slipped to 3.836%.
PULLBACK DATA:
-Drop from Top: 7.2%. 25.4% max (on a closing basis).
-Trading Days since Top: 374-days.
The S&P 500 is 11.2% ABOVE its 200-dMA and 5.3%
ABOVE its 50-dMA.
*I won’t call the correction over until the S&P 500
makes a new-high; however, evidence suggests the bottom was in the 3600 area
and we called a buy on 4 October 2022.
MY TRADING POSITIONS:
I am not trading as much as in the past. You may wish to
use the momentum charts and/or the Monday 40-day gain charts for trading the
Dow stocks and ETFs.
MSFT – Microsoft.
XLK – Technology ETF.
XLY - Consumer Discretionary ETF.
KRE – Regional Banking ETF. This is a very small position
for me. KRE tested the May 4 low of 36.08 on much lower volume 11 &
12 May.
I haven’t sold yet. On the positive side, it has not
breached its recent low around 36.
SHY – Short term bonds. 30-day yield is 5.04% - 9 June
2023. (Trailing 1-year yield is 3.04%.) Once this weak period ends, I’ll sell
SHY and buy stocks/stock ETFs.
TODAY’S COMMENT:
10 Trading days ago, on 15 June, RSI, Bollinger Bands,
Breadth-vs-the-S&P 500 and my Money Trend indicator all suggested a
short-term top and it was a statistically significant up-day. The S&P 500 was 4426.
After a 2-week, weak period the S&P 500 has shrugged
off its malaise and again climbed to its upper trend line (going back to the
October lows) and closed slightly higher at 4450.
Today, Friday was another statistically significant up-day.
That just means that the price-volume move exceeded my statistical parameters.
Statistics show that a statistically-significant, up-day is followed by a
down-day about 60% of the time. Tops almost
always occur on Statistically-significant, up-days, but not all
statistically-significant, up-days occur at tops. Today could be a short-term
top, but, unlike 2-weeks ago, there are now only 2 top indicators that are
bearish and that is not a strong top signal. If the markets continue to make
big moves up next week, we’ll see more weakness in the markets. We could still
see a pullback, or alternatively, the Index may crawl along the upper
trend-line for a while longer.
The S&P 500 remains stretched too far ahead of
breadth, so I still expect weakness in the Index. The catch is, this one
indicator alone is not enough to call a top and the Friday summary of
Indicators has improved a lot.
This above discussion helps explain why I have pointed
out that short-term trading is a fool’s game. Mr. Market doesn’t always follow
indicators – mine or anyone else’s, especially when we are projecting a small pullback.
Here’s my weekly review of indicators:
The weekly rundown of indicators reversed to the Bull
side (now 8-bear and 14-bull). (These indicators tend to be both long-term and
short-term, so they are different than the 20 that I report on daily.)
BULL SIGNS
-Today (30 June) was a Follow-thru day that cancels prior
Distribution Days.
-The 10-dMA percentage of issues advancing on
the NYSE (Breadth) is above 50%.
-The 50-dMA percentage of issues advancing on the NYSE
(Breadth) is above 50%.
-The 100-dMA percentage of issues advancing on
the NYSE (Breadth) is above 50%.
-My Money Trend indicator is rising.
-McClellan Oscillator.
-The long-term, 50-dEMA, Fosback Hi-Low Logic Index.
-Slope of the 40-dMA of New-highs is rising.
-The Smart Money (late-day action).
-On average, the size of up-moves has been larger than
the size of down-moves over the last month.
-VIX indicator.
-The 5-10-20 Timer System is BUY.
-The 5-day EMA is above the 10-day EMA so short-term
momentum is bullish.
-S&P 500 spread vs. Utilities (XLU-ETF) shows the
Index outpacing Utilities.
NEUTRAL
-There have been 1 Statistically-Significant days (big
moves in price-volume) in the last 15-days.
-Sentiment.
-Bollinger Band Squeeze 28 April - expired.
-Bollinger Bands.
-The 50-dMA percentage of issues advancing on the NYSE
(Breadth) has not been below 50%, for more than 3 days in a row.
-Overbought/Oversold Index (Advance/Decline Ratio).
-There was a Zweig Breadth Thrust 31 March. That’s a
rare, very-bullish sign, but the McClellan Oscillator subsequently turned
negative, so this indicator has expired.
-The S&P 500 is 11.2% above its 200-dMA. (Bear
indicator is 12% above the 200-day.)
-The short-term, 10-day EMA, Fosback Hi-Low Logic Index
is neutral.
-There have been 4 up-days over the last 10 sessions – neutral.
-There have been 12 up-days over the last 20 sessions -
neutral.
-The graph of the 100-day Count (the 100-day sum of
up-days) is neutral.
-RSI
-There was a 90% down-volume day 9 March.
-There was a Hindenburg Omen signal 3 May 2023. The
McClellan Oscillator turned positive 18 May. – Expired.
-The Calm-before-the-Storm/Panic Indicator flashed a
panic-buying signal 10 November - expired.
-2.8% of all issues traded on the NYSE made new, 52-week
highs when the S&P 500 made a new all-time-high, 3 January 2022. (There is
no bullish signal for this indicator.) This indicated that the advance was too
narrow and a correction was likely to be >10%. It proved correct, but is now
Expired.
-10 May there was a Bullish Outside Reversal Day –
Expired.
BEAR SIGNS
-The smoothed advancing volume on the NYSE is falling.
-Issues advancing on the NYSE (Breadth) compared to the
S&P 500. The Index is too far ahead of Breadth.
-Smoothed Buying Pressure minus Selling Pressure is falling.
-MACD of S&P 500 price made a bearish crossover 26
May
-Long-term new-high/new-low data.
-Short-term new-high/new-low data.
-XLI-ETF (Cyclical Industrials) is underperforming the
S&P 500; the trend direction is flat to slightly down.
-45% of the 15-ETFs that I track have been up over the
last 10-days.
On Friday, 21 February, 2 days after the top before the
Coronavirus pullback, there were 10 bear-signs and 1 bull-sign. Now there
are 8 bear-signs and 14-Bull. Last week, there were 13 bear-sign and 8
bull-signs.
The daily spread of 20 Indicators (Bulls minus Bears) remained
from +4 (a positive number is bullish; negatives are bearish); the 10-day
smoothed sum that smooths the daily fluctuations declined from -28 to -29.
(The trend direction is more important than the actual number for the 10-day
value.) These numbers sometimes change after I post the blog based on data that
comes in late. Most of these 20 indicators are short-term so they tend to
bounce around a lot.
LONG-TERM INDICATOR: The Long Term NTSM indicator remained
BUY: PRICE & VIX are positive; SENTIMENT & VOLUME are neutral.
(The important BUY in this indicator was on 21 October,
7-days after the bottom. For my NTSM overall signal, I suggested that a
short-term buying opportunity occurred on 27 September (based on improved
market internals on the retest), although without market follow-thru, I was
unwilling to call a buy; however, I did close shorts and increased stock
holdings. I issued a Buy-Signal on 4 October, 6-days before the final bottom,
based on stronger market action that confirmed the market internals signal. The
NTSM sell-signal was issued 20 December, 8 sessions before the high of this
recent bear market, based on the bearish “Friday Rundown” of indicators.)
Bottom line: I remain a cautious Bull, expecting a
decline of around 4-5% on the S&P 500 to start soon.
ETF - MOMENTUM ANALYSIS:
TODAY’S RANKING OF 15 ETFs
(Ranked Daily)
ETF ranking follows:
The top ranked ETF receives
100%. The rest are then ranked based on their momentum relative to the leading
ETF.
*For additional background on
the ETF ranking system see NTSM Page at…
http://navigatethestockmarket.blogspot.com/p/exchange-traded-funds-etf-ranking.html
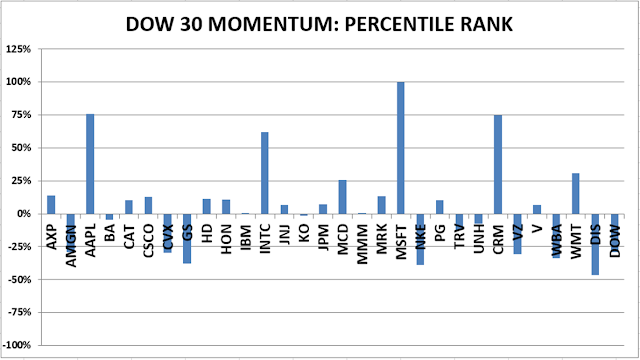
DOW STOCKS - TODAY’S MOMENTUM RANKING
OF THE DOW 30 STOCKS (Ranked Daily)
DOW 30 momentum ranking
follows:
The top ranked Stock receives
100%. The rest are then ranked based on their momentum relative to the leading Stock.
For more details, see NTSM
Page at…
https://navigatethestockmarket.blogspot.com/p/a-system-for-trading-dow-30-stocks-my_8.html
FRIDAY MARKET INTERNALS (NYSE
DATA)
My basket of Market Internals
remained HOLD. (My basket of Market Internals is a decent trend-following analysis of
current market action, but should not be used alone for short term trading.
They are most useful when they diverge from the Index.)
...My current invested
position is about 55% stocks, including stock mutual funds and ETFs. I’m
usually about 50% invested in stocks.
I trade about 15-20% of the
total portfolio using the momentum-based analysis I provide here. If I can see
a definitive bottom, I’ll add a lot more stocks to the portfolio using an
S&P 500 ETF.
Friday will be a busy day, so I’ll post Friday’s Blog late
Friday or on Saturday.
“Trade what you see; not what you think.” – The Old Fool,
Richard McCranie, trader extraordinaire.
JOBLESS CLAIMS (NY Post)
“The number of Americans filing new claims for
unemployment benefits fell last week by the most in 20 months, offering an
upbeat picture of the labor market that could see the Federal
Reserve continuing to raise interest rates to cool demand.”
Story at...
https://nypost.com/2023/06/29/jobless-claims-post-biggest-drop-in-20-months/
GDP (CNBC)
“Gross domestic product increased at a 2% annualized pace
for the January-through-March period, up from the previous estimate of 1.3%...”Story
at...
https://www.cnbc.com/2023/06/29/first-quarter-economic-growth-was-actually-2percent-up-from-1point3percent-first-reported-in-major-gdp-revision.html
MARKET REPORT / ANALYSIS
-Thursday the S&P 500 rose about 5% to 4396.
-VIX rose about 0.8% to 13.54.
-The yield on the 10-year Treasury rose to 3.846%.
PULLBACK DATA:
-Drop from Top: 8.3%. 25.4% max (on a closing basis).
-Trading Days since Top: 372-days.
The S&P 500 is 9.9% ABOVE its 200-dMA and 4.2%
ABOVE its 50-dMA.
*I won’t call the correction over until the S&P 500
makes a new-high; however, evidence suggests the bottom was in the 3600 area
and we called a buy on 4 October 2022.
MY TRADING POSITIONS:
I am not trading as much as in the past. You may wish to
use the momentum charts and/or the Monday 40-day gain charts for trading the
Dow stocks and ETFs.
MSFT – Microsoft.
XLK – Technology ETF.
XLY - Consumer Discretionary ETF.
KRE – Regional Banking ETF. This is a very small position
for me. KRE tested the May 4 low of 36.08 on much lower volume 11 &
12 May.
I haven’t sold yet. On the positive side, it has not
breached its recent low around 36.
SHY – Short term bonds. 30-day yield is 5.04% - 9 June
2023. (Trailing 1-year yield is 3.04%.) Once this weak period ends, I’ll sell
SHY and buy stocks/stock ETFs.
TODAY’S COMMENT:
Well, so much for a decline. 9 Trading days ago, on 15 June, RSI, Bollinger
Bands, Breadth-vs-the-S&P 500 and my Money Trend indicator all suggested a
short-term top. The S&P 500 was
4426. For now, that remains the
short-term top, while some of the warnings that suggested a decline have waned.
However, I still have warning signs flashing. I think the
most significant one is that Breadth (issues advancing on the NYSE) compared to
the S&P 500 shows that the Index is too far ahead of the market in
general. This usually leads to a decline
of some kind. In this case I expect a
decline toward the 50-dMA. So far, the Index declined to about 3% above the 50-day a couple of days ago. I’d expect it to be within 1%. Will it make it? We’ll see.
The daily spread of 20 Indicators (Bulls minus Bears) improved
from -5 to +4 (a positive number is bullish; negatives are bearish); the 10-day
smoothed sum that smooths the daily fluctuations declined from -25 to -28.
(The trend direction is more important than the actual number for the 10-day
value.) These numbers sometimes change after I post the blog based on data that
comes in late. Most of these 20 indicators are short-term so they tend to
bounce around a lot.
LONG-TERM INDICATOR: The Long Term NTSM indicator improved
to BUY: PRICE & VIX are positive; SENTIMENT & VOLUME are neutral.
(The important BUY in this indicator was on 21 October,
7-days after the bottom. For my NTSM overall signal, I suggested that a
short-term buying opportunity occurred on 27 September (based on improved
market internals on the retest), although without market follow-thru, I was
unwilling to call a buy; however, I did close shorts and increased stock
holdings. I issued a Buy-Signal on 4 October, 6-days before the final bottom,
based on stronger market action that confirmed the market internals signal. The
NTSM sell-signal was issued 20 December, 8 sessions before the high of this
recent bear market, based on the bearish “Friday Rundown” of indicators.)
Bottom line: I remain a cautious Bull, expecting a
decline of around 3% on the S&P 500.
ETF - MOMENTUM ANALYSIS:
TODAY’S RANKING OF 15 ETFs
(Ranked Daily)
ETF ranking follows:
The top ranked ETF receives
100%. The rest are then ranked based on their momentum relative to the leading
ETF.
*For additional background on
the ETF ranking system see NTSM Page at…
http://navigatethestockmarket.blogspot.com/p/exchange-traded-funds-etf-ranking.html
DOW STOCKS - TODAY’S MOMENTUM RANKING
OF THE DOW 30 STOCKS (Ranked Daily)
DOW 30 momentum ranking
follows:
 The top ranked Stock receives
100%. The rest are then ranked based on their momentum relative to the leading Stock.
The top ranked Stock receives
100%. The rest are then ranked based on their momentum relative to the leading Stock.
For more details, see NTSM
Page at…
https://navigatethestockmarket.blogspot.com/p/a-system-for-trading-dow-30-stocks-my_8.html
THURSDAY MARKET INTERNALS
(NYSE DATA)
My basket of Market Internals improved to HOLD. (My basket of Market
Internals is a decent trend-following analysis of current market action, but
should not be used alone for short term trading. They are most useful when they
diverge from the Index.)
...My current invested
position is about 55% stocks, including stock mutual funds and ETFs. I’m
usually about 50% invested in stocks.
I trade about 15-20% of the
total portfolio using the momentum-based analysis I provide here. If I can see
a definitive bottom, I’ll add a lot more stocks to the portfolio using an
S&P 500 ETF.
“Trade what you see; not what you think.” – The Old Fool,
Richard McCranie, trader extraordinaire.
EIA CRUDE OIL INVENTORIES (EIA)
“U.S. commercial crude oil inventories (excluding those
in the Strategic Petroleum Reserve) decreased by 9.6 million barrels from the
previous week. At 453.7 million barrels, U.S. crude oil inventories are
approximately 1% below the five year average for this time of year.” Report
at...
https://ir.eia.gov/wpsr/wpsrsummary.pdf
ANNUAL ENERGY OUTLOOK (EIA)
“High
international demand leads to continued growth in U.S. production, and combined
with relatively little growth in domestic consumption, allows the United States
to remain a net exporter of petroleum products and natural gas through 2050 in
all AEO2023 cases. Despite no significant change in the
domestic consumption of petroleum and other liquids through 2040 across most
AEO2023 cases, we expect U.S. production to remain at historically high
volumes. Domestic natural gas consumption also remains relatively stable,
despite a shift in electricity generation towards renewables. Production of
natural gas, however, continues to grow in response to international demand for
liquefied natural gas.” Press release at...
https://www.eia.gov/pressroom/releases/press529.php
CHEVROLET JUST KILLED THE 40,000 SILVERADO ELECTRIC TRUCK
(msn.com)
“...the forthcoming 2024 Silverado electric
truck... starting price for the Work Truck, or WT version [was]... $40,000.
...But now, Chevrolet has announced its WT EV pricing.
The starting price is radically higher than stated in the original hype since
its reveal in January 2022. In fact, the price has almost doubled. Now, the
base price for the Silverado 3WT is $74,800.” Story at...
Chevrolet
Just Killed the $40,000 Silverado Electric Truck (msn.com)
FORD LOSES NEARLY 60,000 FOR EVERY ELECTRIC VEHICLE SOLD
(The Street.com)
“Ford (F) only delivered 12,000
electric vehicles in the first quarter, which means that the carmaker lost
$58,333 for each clean car sold during this period... Last month, the Blue Oval
said it expects an operating loss of $3 billion for Ford Model e this year.”
https://www.thestreet.com/technology/ford-loses-nearly-60000-for-every-electric-vehicle-sold
Don’t worry. We taxpayers have loaned Ford 3-billion
dollars to build a battery plant.
MARKET REPORT / ANALYSIS
-Wednesday the S&P 500 dipped about 1 point to 4377.
-VIX slipped about 2% to 13.43.
-The yield on the 10-year Treasury was 3.713%.
PULLBACK DATA:
-Drop from Top: 8.8%. 25.4% max (on a closing basis).
-Trading Days since Top: 372-days.
The S&P 500 is 9.5% ABOVE its 200-dMA and 3.8%
ABOVE its 50-dMA.
*I won’t call the correction over until the S&P 500
makes a new-high; however, evidence suggests the bottom was in the 3600 area
and we called a buy on 4 October 2022.
MY TRADING POSITIONS:
I am not trading as much as in the past. You may wish to
use the momentum charts and/or the Monday 40-day gain charts for trading the
Dow stocks and ETFs.
MSFT – Microsoft.
XLK – Technology ETF.
XLY - Consumer Discretionary ETF.
KRE – Regional Banking ETF. This is a very small position
for me. KRE tested the May 4 low of 36.08 on much lower volume 11 &
12 May.
I’ll probably sell this position – it has been very
weak recently. But I forgot to! In my defense - it is a small
position. On the positive side, it has not breached its recent low around 36.
SHY – Short term bonds. 30-day yield is 5.04% - 9 June
2023. (Trailing 1-year yield is 3.04%.) Once this weak period ends, I’ll sell
SHY and buy stocks/stock ETFs.
TODAY’S COMMENT:
Not much change from yesterday – I still am expecting a
decline toward the 50-dMA.
The daily spread of 20 Indicators (Bulls minus Bears) declined
from -2 to -5 (a positive number is bullish; negatives are bearish); the 10-day
smoothed sum that smooths the daily fluctuations declined from -13 to -25.
(The trend direction is more important than the actual number for the 10-day
value.) These numbers sometimes change after I post the blog based on data that
comes in late. Most of these 20 indicators are short-term so they tend to
bounce around a lot.
LONG-TERM INDICATOR: The Long Term NTSM indicator
remained HOLD: PRICE is positive; SENTIMENT, VIX & VOLUME are neutral.
(The important BUY in this indicator was on 21 October,
7-days after the bottom. For my NTSM overall signal, I suggested that a
short-term buying opportunity occurred on 27 September (based on improved
market internals on the retest), although without market follow-thru, I was
unwilling to call a buy; however, I did close shorts and increased stock
holdings. I issued a Buy-Signal on 4 October, 6-days before the final bottom,
based on stronger market action that confirmed the market internals signal. The
NTSM sell-signal was issued 20 December, 8 sessions before the high of this
recent bear market, based on the bearish “Friday Rundown” of indicators.)
Bottom line: I remain a cautious Bull, expecting a
decline of another 2-3% on the S&P 500.
ETF - MOMENTUM ANALYSIS:
TODAY’S RANKING OF 15 ETFs
(Ranked Daily)
ETF ranking follows:
The top ranked ETF receives
100%. The rest are then ranked based on their momentum relative to the leading
ETF.
*For additional background on
the ETF ranking system see NTSM Page at…
http://navigatethestockmarket.blogspot.com/p/exchange-traded-funds-etf-ranking.html
DOW STOCKS - TODAY’S MOMENTUM RANKING
OF THE DOW 30 STOCKS (Ranked Daily)
DOW 30 momentum ranking
follows:
The top ranked Stock receives
100%. The rest are then ranked based on their momentum relative to the leading Stock.
For more details, see NTSM
Page at…
https://navigatethestockmarket.blogspot.com/p/a-system-for-trading-dow-30-stocks-my_8.html
WEDNESDAY MARKET INTERNALS
(NYSE DATA)
My basket of Market Internals slipped to SELL. (My basket of Market
Internals is a decent trend-following analysis of current market action, but
should not be used alone for short term trading. They are most useful when they
diverge from the Index.)
...My current invested
position is about 55% stocks, including stock mutual funds and ETFs. I’m usually
about 50% invested in stocks.
I trade about 15-20% of the
total portfolio using the momentum-based analysis I provide here. If I can see
a definitive bottom, I’ll add a lot more stocks to the portfolio using an
S&P 500 ETF.
“Trade what you see; not what you think.” – The Old Fool,
Richard McCranie, trader extraordinaire.
“What we’ve done in our politics is create a situation
where we’re electing idiots...And so I don’t look at it through the lens of
like, you know, is this what I should do or what I shouldn’t do? I look at it
through the lens of how do we elect serious people? And I think electing
serious people can’t be partisan.” – Liz Cheny, former GOP Representative
(WY)
“The Supreme Court on Tuesday rejected the theory that
state legislatures have almost unlimited power to decide the rules for federal
elections and draw partisan congressional maps without interference from state
courts. The Constitution’s Elections Clause “does not insulate state
legislatures from the ordinary exercise of state judicial review,” Chief
Justice John G. Roberts Jr. wrote in a 6 to 3 decision.” Story at...
Supreme
Court rejects theory that would have meant radical changes to election rules
(msn.com)
“If the [super volcano in Italy] ...erupts, it could
launch molten rock and volcanic gases high into the stratosphere. It could lead
to 100ft tsunamis, leading sulfur, and toxic ash to spread causing fears it
could destroy crops and wildlife, plunging the Earth into a global winter.”
Story at...
Supervolcano
'on verge of eruption' and could spark mass extinction and nuclear winter
(msn.com)
Mass extinction and nuclear winter? Time to concentrate on
short-term investments! This could be good news though – we won’t have to
listen to Global Warming hype anymore.
DURABLE ORDERS (RTT News)
“Reflecting a continued spike in orders for
transportation equipment, the Commerce Department released a report on Tuesday
showing an unexpected surge in new orders for U.S. manufactured durable goods
in the month of May. The Commerce Department said durable goods orders shot up
by 1.7 percent in May...” Story at...
https://www.rttnews.com/3372440/u-s-durable-goods-orders-unexpectedly-jump-in-may-as-aircraft-demand-soars.aspx
CONSUMER CONFIDENCE (Conference Board via prnewswire)
"’Consumer confidence improved in June to its
highest level since January 2022, reflecting
improved current conditions and a pop in expectations,’ said Dana Peterson, Chief Economist at The Conference
Board... ‘Although the Expectations Index remained a hair below the
threshold signaling recession ahead, a new measure found considerably fewer
consumers now expect a recession in the next 12 months compared to May.” Press
release at...
https://www.prnewswire.com/news-releases/us-consumer-confidence-improved-substantially-in-june-301864485.html
NEW HOME SALES (CNN)
“New home sales surged in May, as buyers looked to new
construction as an alternative to the low inventory of existing homes for sale.
Sales of newly constructed homes were up 12.2% in May from April, and up 20%
from a year ago...” Story at...
https://www.cnn.com/2023/06/27/homes/new-home-sales-may/index.html
WHAT HISTORY SAYS ABOUT THE 2ND HALF (MarketWatch)
“If history is any indication, investors may have reason
to be even more optimistic about the next six months, according to Thomas Lee,
founder of Fundstrat Global Advisors. In the 22 instances when the S&P 500
finished the first half of the year more than 10% higher since 1950, the median
return for the second half is 8% with a 82% win ratio, according to Fundstrat’s
data.
The
stock market is headed for a big first-half gain. What history says that means
for the rest of 2023. (msn.com)
ELECTRIC VEHICLE CALAMITY (The Telegraph)
“...our obsession with centrally planned decarbonisation
is causing all sorts of unintended consequences. Electric vehicles put a
massive stress on roads: last month it was reported that their sheer weight
could sink our bridges. The batteries are heavy, with many popular
models weighing more than two tonnes, and while that might be fine for
motorways built for big lorries, on smaller roads it has put huge strain on
surfaces of many highways. They are literally buckling under the pressure
[creating a pothole crisis]...
... Everyone accepts that we need to combat climate
change... But it needs to be properly planned and well-executed. Instead we
don’t have enough chargers for all the EVs we are expected to buy. We don’t
generate enough electricity to power them all up, And now it turns out that our
roads are woefully unprepared for all the extra strain that will be put on
them.” Story at...
Time
to slam the brakes on the electric vehicle calamity (msn.com)
MARKET REPORT / ANALYSIS
-Tuesday the S&P 500 rose about 1.2% to 4378.
-VIX slipped about 3% to 13.77.
-The yield on the 10-year Treasury rose to 3.767%.
PULLBACK DATA:
-Drop from Top: 8.7%. 25.4% max (on a closing basis).
-Trading Days since Top: 372-days.
The S&P 500 is 9.6% ABOVE its 200-dMA and 4% ABOVE
its 50-dMA.
*I won’t call the correction over until the S&P 500
makes a new-high; however, evidence suggests the bottom was in the 3600 area
and we called a buy on 4 October 2022.
MY TRADING POSITIONS:
I am not trading as much as in the past. You may wish to
use the momentum charts and/or the Monday 40-day gain charts for trading the
Dow stocks and ETFs.
MSFT – Microsoft.
XLK – Technology ETF.
XLY - Consumer Discretionary ETF.
KRE – Regional Banking ETF. This is a very small position
for me. KRE tested the May 4 low of 36.08 on much lower volume 11 &
12 May.
I’ll probably sell this position – it has been very
weak recently. But I forgot to! In my defense - it is a small
position. On the positive side, it has not breached its recent low around 36.
SHY – Short term bonds. 30-day yield is 5.04% - 9 June
2023. (Trailing 1-year yield is 3.04%.) Once this weak period ends, I’ll sell SHY
and buy stocks/stock ETFs.
TODAY’S COMMENT:
I don’t think the weak period is over for the stock
market. Buying Pressure minus Selling Pressure is still on the sell side; my
Money Trend indicator also remains bearish.
On a cautionary note: short-term trading is a fool’s game
and I may not be able to identify a good buying point. That said, I think the time to
buy will be when there is a statistically significant day and the Index is near
its 50-dMA (now about 4210 on the S&P 500).
A new disconcerting issue arrived today: Sentiment is
very high and close to issuing a sell signal. I measure Sentiment as a 5-day
moving average of %-Bulls (Bulls/{bulls+bears}) based on the amounts invested
in Rydex/Guggenheim mutual funds.
It is currently at 90%-bulls (as of Monday’s close). On a
standard deviation basis this again close to levels seen during the dot.com
crash. This isn’t by itself a great indicator since sentiment can remain
elevated for some time, but it is a level that has preceded pullbacks of
varying degrees – from small pullbacks of a couple % to major crashes. I’d need to see more negative signs to take
action, but it is a cautionary indication.
I’ll stick with my suggestion that the S&P 500 is
most likely to decline about 3-4% below today’s close. I’d be surprised if the Index drops below its
50-dMA, but it certainly could happen.
The daily spread of 20 Indicators (Bulls minus Bears) improved
from -9 to -2 (a positive number is bullish; negatives are bearish); the 10-day
smoothed sum that smooths the daily fluctuations declined from -3 to -13.
(The trend direction is more important than the actual number for the 10-day
value.) These numbers sometimes change after I post the blog based on data that
comes in late. Most of these 20 indicators are short-term so they tend to
bounce around a lot.
LONG-TERM INDICATOR: The Long Term NTSM indicator remained
HOLD: PRICE is positive; SENTIMENT, VIX & VOLUME are neutral.
(The important BUY in this indicator was on 21 October,
7-days after the bottom. For my NTSM overall signal, I suggested that a
short-term buying opportunity occurred on 27 September (based on improved
market internals on the retest), although without market follow-thru, I was
unwilling to call a buy; however, I did close shorts and increased stock
holdings. I issued a Buy-Signal on 4 October, 6-days before the final bottom,
based on stronger market action that confirmed the market internals signal. The
NTSM sell-signal was issued 20 December, 8 sessions before the high of this
recent bear market, based on the bearish “Friday Rundown” of indicators.)
Bottom line: I remain a cautious Bull, expecting a
decline of another 3-4% on the S&P 500.
ETF - MOMENTUM ANALYSIS:
TODAY’S RANKING OF 15 ETFs
(Ranked Daily)
ETF ranking follows:
The top ranked ETF receives
100%. The rest are then ranked based on their momentum relative to the leading
ETF.
*For additional background on
the ETF ranking system see NTSM Page at…
http://navigatethestockmarket.blogspot.com/p/exchange-traded-funds-etf-ranking.html
DOW STOCKS - TODAY’S MOMENTUM RANKING
OF THE DOW 30 STOCKS (Ranked Daily)
DOW 30 momentum ranking
follows:
The top ranked Stock receives
100%. The rest are then ranked based on their momentum relative to the leading Stock.
For more details, see NTSM
Page at…
https://navigatethestockmarket.blogspot.com/p/a-system-for-trading-dow-30-stocks-my_8.html
TUESDAY MARKET INTERNALS (NYSE
DATA)
My basket of Market Internals improved to HOLD. (My basket of Market
Internals is a decent trend-following analysis of current market action, but
should not be used alone for short term trading. They are most useful when they
diverge from the Index.)
..My current invested
position is about 55% stocks, including stock mutual funds and ETFs. I’m
usually about 50% invested in stocks.
I trade about 15-20% of the
total portfolio using the momentum-based analysis I provide here. If I can see
a definitive bottom, I’ll add a lot more stocks to the portfolio using an
S&P 500 ETF.
“Trade what you see; not what you think.” – The Old Fool,
Richard McCranie, trader extraordinaire.
“As math and reading scores plummet, perhaps public
education should focus on teaching fundamentals.” - Michael Ramirez.
“...the demand from figures like former Sen. Claire McCaskill
(D-Mo.) for people to “back off” on the story [by whistleblowers that there was
interference in the Hunter Biden investigation] is being heeded by some in the
media, in again blacking out or downplaying the story. While many of us have
stressed the need to authenticate these statements, Hunter Biden has notably
not denied that he sent the message and the allegations from the investigation
have self-verifying elements. The news blackout again raises concerns over
a de facto state media in the United States that operates by
consent rather than coercion. This is a major story either way it turns out but
networks and newspapers are again showing a distinct lack of curiosity.”
Jonathon Turley.
https://jonathanturley.org/2023/06/24/everybody-needs-to-back-off-the-media-and-political-figures-continue-to-ignore-the-biden-corruption-scandal/
CASS FREIGHT INDEX (CASS Information Systems)
“The shipments component of the Cass Freight Index® rose
1.9% m/m in May, but fell 0.8% m/m in seasonally adjusted (SA) terms and fell
5.6% y/y. While it was a softer-than-normal seasonal increase from April, it
was nonetheless an increase.
Freight markets continue to work through a downcycle
which featured its first y/y decline 17 months ago. The past three downcycles
have ranged from 21 to 28 months.
Declining real retail sales trends and ongoing destocking
remain the primary headwinds to freight volumes, but dynamics are shifting as
real incomes improve and the worst of the destock is in the rearview.”
https://www.cassinfo.com/freight-audit-payment/cass-transportation-indexes/may-2023
Freight doesn’t seem to support the recession call that
many pundits continue to make. This
could change, of course, but for now, recession is not in sight.
BEARISH TREND PLAYING OUT (Heritage Capital)
“I do not believe the bull market has ended. Let’s get
that out of the way. I don’t even think this phase of the rally has ended. As
we all know, the stock market has seen a really nice move over the past month,
especially in the NASDAQ 100. No secrets there. This looks to me like a normal,
healthy and telegraphed mild pullback. And one that I would be a buyer of for
another run to new highs in early July.” - Paul Schatz, President Heritage
Capital. Commentary at...
https://investfortomorrow.com/blog/bearish-trend-playing-out-bonds-need-to-shape-up/
MARKET REPORT / ANALYSIS
-Monday the S&P 500 dropped about 0.5% to 4329.
-VIX rose about 6% to 14.25.
-The yield on the 10-year Treasury dipped to 3.724%.
PULLBACK DATA:
-Drop from Top: 9.8%. 25.4% max (on a closing basis).
-Trading Days since Top: 370-days.
The S&P 500 is 8.4% ABOVE its 200-dMA and 2.9%
ABOVE its 50-dMA.
*I won’t call the correction over until the S&P 500
makes a new-high; however, evidence suggests the bottom was in the 3600 area
and we called a buy on 4 October 2022.
MY TRADING POSITIONS:
I am not trading as much as in the past. You may wish to
use the momentum charts and/or the Monday 40-day gain charts for trading the
Dow stocks and ETFs.
MSFT – Microsoft.
XLK – Technology ETF.
XLY - Consumer Discretionary ETF.
KRE – Regional Banking ETF. This is a very small position
for me. KRE tested the May 4 low of 36.08 on much lower volume 11 &
12 May.
I said earlier that I’ll probably sell this position – it has been
very weak recently. But I forgot to and I haven't sold yet - in my defense, it is a small
position.
SHY – Short term bonds. 30-day yield is 5.04% - 9 June
2023. (Trailing 1-year yield is 3.04%.) Once this weak period ends, I’ll sell
SHY and buy stocks/stock ETFs.
TODAY’S COMMENT:
The close wasn’t pretty (late-day, sell-off) and a couple
of other bear signs popped up, too.
MACD (Moving Average Convergence Divergence) switched to a
bear signal today. The 50-dMA of issues advancing on the NYSE has been down for
more than 3 sessions. That’s my
definition of a correction. Ok, but I still don’t expect a large pullback.
Repeating: While my Friday summary of indicators last Friday was well
to the Bear side, some of the bull indicators are reasonably reliable. This tends to bolster the view that the
current pullback is likely to be small. The markets do not appear to be
starting a major correction, so I’ll stick with my suggestion that the S&P
500 is most likely to decline about 2-3% below today’s close. I’d be surprised if the Index drops below its
50-dMA, but it certainly could happen.
The daily spread of 20 Indicators (Bulls minus Bears) declined
from -8 to -9 (a positive number is bullish; negatives are bearish); the 10-day
smoothed sum that smooths the daily fluctuations declined from +14 to -3.
(The trend direction is more important than the actual number for the 10-day
value.) These numbers sometimes change after I post the blog based on data that
comes in late. Most of these 20 indicators are short-term so they tend to
bounce around a lot.
LONG-TERM INDICATOR: The Long Term NTSM indicator declined
to HOLD: PRICE is positive; SENTIMENT, VIX & VOLUME are neutral.
(The important BUY in this indicator was on 21 October,
7-days after the bottom. For my NTSM overall signal, I suggested that a
short-term buying opportunity occurred on 27 September (based on improved
market internals on the retest), although without market follow-thru, I was
unwilling to call a buy; however, I did close shorts and increased stock
holdings. I issued a Buy-Signal on 4 October, 6-days before the final bottom,
based on stronger market action that confirmed the market internals signal. The
NTSM sell-signal was issued 20 December, 8 sessions before the high of this
recent bear market, based on the bearish “Friday Rundown” of indicators.)
Bottom line: I remain a cautious Bull, expecting a
decline of another 2-3% on the S&P 500.
ETF - MOMENTUM ANALYSIS:
TODAY’S RANKING OF 15 ETFs
(Ranked Daily)
ETF ranking follows:
The top ranked ETF receives
100%. The rest are then ranked based on their momentum relative to the leading
ETF.
*For additional background on
the ETF ranking system see NTSM Page at…
http://navigatethestockmarket.blogspot.com/p/exchange-traded-funds-etf-ranking.html
DOW STOCKS - TODAY’S MOMENTUM RANKING
OF THE DOW 30 STOCKS (Ranked Daily)
DOW 30 momentum ranking
follows:
The top ranked Stock receives
100%. The rest are then ranked based on their momentum relative to the leading Stock.
For more details, see NTSM
Page at…
https://navigatethestockmarket.blogspot.com/p/a-system-for-trading-dow-30-stocks-my_8.html
MONDAY MARKET INTERNALS (NYSE
DATA)
My basket of Market
Internals remained SELL. (My basket of Market Internals
is a decent trend-following analysis of current market action, but should not
be used alone for short term trading. They are most useful when they diverge
from the Index.)
...My current invested
position is about 55% stocks, including stock mutual funds and ETFs. I’m
usually about 50% invested in stocks.
I trade about 15-20% of the
total portfolio using the momentum-based analysis I provide here. If I can see
a definitive bottom, I’ll add a lot more stocks to the portfolio using an
S&P 500 ETF.


 My basket of Market Internals
remained HOLD. (My basket of Market Internals is a decent trend-following analysis of
current market action, but should not be used alone for short term trading.
They are most useful when they diverge from the Index.)
My basket of Market Internals
remained HOLD. (My basket of Market Internals is a decent trend-following analysis of
current market action, but should not be used alone for short term trading.
They are most useful when they diverge from the Index.)