“U.S. personal income rose just 0.3 percent in March,
compared with expectations of 0.4 percent. On the consumption side, personal
spending in February was revised lower to a rise of 0.3 percent, instead of the
previously reported 0.4 percent increase.” Story at…
PCE PRICES (Reuters)
“U.S. consumer prices accelerated in the year to March,
with a measure of underlying inflation surging to near the Federal Reserve’s 2
percent target as weak readings from last year dropped out of the calculation.”
Story at…
CHICAGO PMI (MarketWatch)
“Chicago PMI inched up in April to a reading of 57.6. The
increase only slightly retraced the big drop in March, when the index fell to
57.4 from 61.9…” Story at…
EARNINGS INSIGHT EXCERPT (FactSet)
“To date, 53% of the companies in the S&P 500 have
reported actual results for Q1 2018. In terms of earnings, more companies are
reporting actual EPS above estimates (79%) compared to the five-year average.
If 79% is the final percentage for the quarter, it will mark the highest
percentage of S&P 500 companies reporting actual EPS above estimates since
FactSet began tracking this metric in Q3 2008…more companies (74%) are
reporting actual sales above estimates compared to the five-year average. In
aggregate, companies are reporting sales that are 1.7% above estimates, which
is also above the five-year average. If 1.7% is the final percentage for the
quarter, it will mark the largest revenue surprise percentage since FactSet
began tracking this metric in Q3 2008.” For full report see FACTSET at…
If this isn’t enough to get investors back in the mood to
buy stocks, we’d better be ready to bail out of this market if selling picks up. In my opinion, nothing is more bearish than
to see the market falling on good earnings news.
BUDGET BLAME (Washington Times)
“While tax cuts take the budget blame, spending does the
debt damage. Proponents of big government spending are happy to stoke the
latest story in the narrative that America is under-taxed. However, quick
comparison of federal revenues and outlays versus their historic averages shows
clearly the fault lies with Washington’s spending, not America’s paying.” Story
at…
MARKET REPORT / ANALYSIS
-Monday the S&P 500 dropped about 0.8% to 2648.
-VIX rose about 3% to 15.93.
-The yield on the 10-year Treasury slipped a bit to 2.955%.
Regarding Friday’s Blog and the chart of the S&P 500 showing
a “symmetrical wedge” pattern, that pattern remains in play. Today the Index dropped
to its lower trend line in that wedge. A break lower will be seen as bearish; a
break above the upper trend line (the 50-dMA at 2687) would be very bullish. In
both cases the break must be confirmed by 2-closes above or below the line in
consideration.
The dramatic drop in VIX over the last 3-months suggests
to me that the correction has ended and markets should rise. News can trump
technical data and today we had news from Israel stating that Iran had cheated
on its nuclear program and that seems to have caused a drop in the markets
after 2PM.
My daily sum of 17 Indicators dropped from +2 to -6; the
10-day smoothed version dropped from -4 to -14.
My plan ahead remains: If the S&P 500 drops to its
prior low of 2581 and there is an unsuccessful retest, I will probably cut
stock holdings again. If we see a successful test I’ll be adding to stocks. I
am expecting a break to the upside, but I have been wrong in the past.
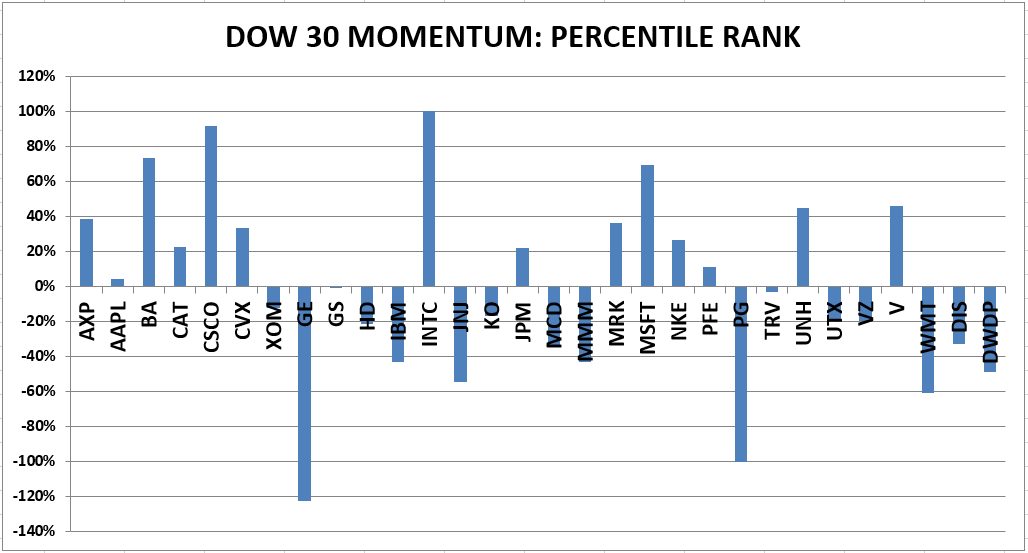
MOMENTUM ANALYSIS IS STILL QUESTIONABLE BUT GETTING
BETTER. As one can see below in both momentum charts, there are still a lot of
issues in negative territory, i.e., they have weak upward momentum. That’s just
an indication that the market is in correction mode and most stocks have been
headed down.
TODAY’S RANKING OF
15 ETFs (Ranked Daily)

The top ranked ETF receives 100%. The rest are then
ranked based on their momentum relative to the leading ETF. While momentum isn’t stock performance per
se, momentum is closely related to stock performance. For example, over the 4-months
from Oct thru mid-February 2016, the number 1 ranked Financials (XLF) outperformed
the S&P 500 by nearly 20%. In 2017 Technology (XLK) was ranked in the top 3
Momentum Plays for 52% of all trading days in 2017 (if I counted correctly.)
XLK was up 35% on the year while the S&P 500 was up 18%.
*For additional background on the ETF ranking system see
NTSM Page at…
TODAY’S RANKING OF THE DOW 30 STOCKS (Ranked Daily)

The top ranked stock receives 100%. The rest are then
ranked based on their momentum relative to the leading stock. (On 5 Apr 2018 I
corrected a coding/graphing error that has consistently shown Nike
incorrectly.)
*I rank the Dow 30 similarly to the ETF ranking system.
For more details, see NTSM Page at…
MONDAY MARKET INTERNALS (NYSE DATA)
Market Internals switched
from Positive to Negative on the market.
Market Internals are a decent trend-following analysis of
current market action but should not be used alone for short term trading. They
are usually right, but they are often late.
They are most useful when they diverge from the Index. In 2014, using these internals alone would
have made a 9% return vs. 13% for the S&P 500 (in on Positive, out on
Negative – no shorting).
Thursday, 18 Apr
2018 I increased stock investments from 35% to 50% based on the
Intermediate/Long-Term Indicator that turned positive on the 17th. For me,
fully invested is a balanced 50% stock portfolio. This is not the time to
take extra risk, so you may want to have less in stocks than normal.
INTERMEDIATE / LONG-TERM INDICATOR
Intermediate/Long-Term
Indicator: Monday, VIX, Volume, Price and Sentiment indicators were
neutral. Overall this is a NEUTRAL indication.