“Trade what you see; not what you think.” – The Old Fool, Richard McCranie, trader extraordinaire.
“Compensation for US workers picked up in the first three months of the year, showing that a major source of inflationary pressure persists and cementing the path for an interest rate hike at the Federal Reserve’s meeting next week. The Employment Cost Index...showed that workers were paid 1.2% more in wages and benefits in the first quarter from the prior three-month period.” Story at...
https://www.cnn.com/2023/04/28/economy/q1-employment-cost-index/index.html
“...personal income increased by 0.3% or $67.9 billion in March... The PCE price index increased by 0.1%, and excluding food and energy, it increased by 0.3%...
https://www.fxempire.com/news/article/march-us-personal-income-rose-while-personal-spending-modestly-increased-and-pce-price-index-grew-slightly-1342734
“The latest Chicago Purchasing Manager's Index (Chicago Business Barometer) shifted up to 48.6 in April from 43.8 in March. This is the eighth straight month in contraction territory however its highest level the index has reached across the time frame. This reading comes in above the Investing.com forecast of 43.5.” Charts and analysis at...
https://www.advisorperspectives.com/dshort/updates/2023/04/28/chicago-pmi-reaches-highest-level-since-august
Friday the S&P 500 rose about 0.8% to 4169.
-VIX fell about 7% to 15.78.
-The yield on the 10-year Treasury dipped to 3.422%.
-Drop from Top: 13.1% as of today. 25.4% max (on a closing basis).
-Trading Days since Top: 331-days.
The S&P 500 is 5.2% ABOVE its 200-dMA and 3.4% ABOVE its 50-dMA.
*I won’t call the correction over until the S&P 500 makes a new-high; however, evidence suggests the bottom was in the 3600 area.
I am not trading as much as in the past. You may wish to use the momentum charts and/or the Monday 40-day gain charts for trading the Dow stocks and ETFs.
XLK – Technology ETF.
XLE – Energy Sector ETF. It hasn’t been doing much recently, but Russia is cutting production and that should help the sector. We have a good dividend in the meantime.
KRE – Regional Banking ETF. This is a small position for me.
SHY – Short term bonds. 30-day yield is 4%. (Trailing 1-year yield is 1.6%.) I’ll hold this, but if the market retests the lows, I’ll sell it and buy stocks.)
Here’s my weekly review of indicators:
The weekly rundown of indicators shifted to the Bull side this week (now 9-bear and 15-bull). (These indicators tend to be both long-term and short-term, so they are different than the 20 that I report on daily.)
-There was a Follow-thru Day 28 April. This cancels all prior Distribution Days.
-The smoothed advancing volume on the NYSE is rising.
-Bollinger Band Squeeze. I’ll put this in the Bull column. It looks like the break out is up.
-The 100-dMA percentage of issues advancing on the NYSE (Breadth) is above 50%.
-MACD of the percentage of issues advancing on the NYSE (breadth) made a bullish crossover 19 April.
-Slope of the 200-dMA is rising.
-Long-term new-high/new-low data. (Turned up today.)
-Short-term new-high/new-low data.
-McClellan Oscillator.
-The long-term, 50-dEMA, Fosback Hi-Low Logic Index is bullish, but may soon be neutral.
-The graph of the 100-day Count (the 100-day sum of up-days) is up.
-On average, the size of up-moves has been larger than the size of down-moves over the last month.
-VIX indicator.
-The 5-10-20 Timer System is BUY.
-The 5-day EMA is above the 10-day EMA so short-term momentum is bullish.
-There have only been 4 Statistically-Significant days (big moves in price-volume) in the last 15-days.
-Sentiment.
-Bollinger Bands.
-Overbought/Oversold Index (Advance/Decline Ratio).
-Issues advancing on the NYSE (Breadth) compared to the S&P 500.
-The S&P 500 is 5.2% above its 200-dMA. (Bear indicator is 12% above the 200-day.)
-12 April there was a Bearish Outside Reversal Day – expired.
-There was a Zweig Breadth Thrust 31 March. That’s a rare, very-bullish sign, but the McClellan Oscillator turned negative, so this indicator has expired.
-The short-term, 10-day EMA, Fosback Hi-Low Logic Index is neutral.
-There have been 6 up-days over the last 10 sessions – neutral.
-There have been 11 up-days over the last 20 sessions - neutral.
-RSI
-There was a 90% down-volume day 9 March. Another one will push this into the Bear category.
-The Calm-before-the-Storm/Panic Indicator flashed a panic-buying signal 10 November - expired.
-There was a Hindenburg Omen signal 8 April 2022 – expired.
-2.8% of all issues traded on the NYSE made new, 52-week highs when the S&P 500 made a new all-time-high, 3 January 2022. (There is no bullish signal for this indicator.) This indicated that the advance was too narrow and a correction was likely to be >10%. It proved correct, but is now Expired
-S&P 500 is underperforming Utilities (XLU-ETF), but not by much and it is headed up. Call it neutral.
-49% of the 15-ETFs that I track have been up over the last 10-days – neutral.
-The 10-dMA percentage of issues advancing on the NYSE (Breadth) is below 50%.
-The 50-dMA percentage of issues advancing on the NYSE (Breadth) is below 50%.
-The 50-dMA percentage of issues advancing on the NYSE (Breadth) has been below 50%, for more than 3 days in a row – bearish.
-Smoothed Buying Pressure minus Selling Pressure is on the sell side and falling.
-MACD of S&P 500 price made a bearish crossover 25 April.
-My Money Trend indicator is falling.
-Slope of the 40-dMA of New-highs is falling.
-The Smart Money (late-day action).
-XLI-ETF (Cyclical Industrials) is underperforming the S&P 500.
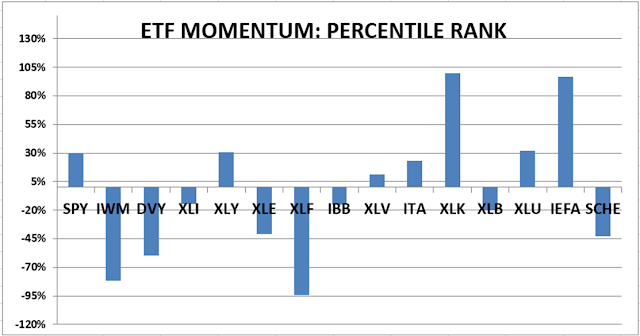
ETF - MOMENTUM ANALYSIS:
TODAY’S RANKING OF 15 ETFs (Ranked Daily)
ETF ranking follows:

The top ranked ETF receives 100%. The rest are then ranked based on their momentum relative to the leading ETF.
*For additional background on the ETF ranking system see NTSM Page at…
http://navigatethestockmarket.blogspot.com/p/exchange-traded-funds-etf-ranking.html
DOW 30 momentum ranking follows:

For more details, see NTSM Page at…
https://navigatethestockmarket.blogspot.com/p/a-system-for-trading-dow-30-stocks-my_8.html