Wednesday, September 30, 2020

ADP Employment Change ... GDP ... Chicago PMI ... EIA Crude Inventories … Lurking Bear Signs ... Coronavirus (Covid-19) … Stock Market Analysis … ETF Trading … Dow 30 Ranking

“Trade what you see; not what you think.” – The Old Fool, Richard McCranie, trader extraordinaire.


“The big money is not in the buying and selling. But in the waiting.” - Charlie Munger, Vice Chairman, Berkshire Hathaway


ADP EMPLOYMENT CHANGE (ADP via PRnewswire)

“Private sector employment increased by 749,000 jobs from August to September according to the September ADP National Employment Report®...The report, which is derived from ADP's actual payroll data, measures the change in total nonfarm private employment each month on a seasonally-adjusted basis...’The labor market continues to recover gradually," said Ahu Yildirmaz, vice president and co-head of the ADP Research Institute.  ‘In September, the majority of sectors and company sizes experienced gains with trade, transportation and utilities; and manufacturing leading the way. However, small businesses continued to demonstrate slower growth.’" Press release at...

https://www.prnewswire.com/news-releases/adp-national-employment-report-private-sector-employment-increased-by-749-000-jobs-in-september-301141870.html


GDP-3RD ESTIMATE (CNBC/AP)

“The U.S. economy plunged at a record rate in the spring but is poised to swing to a record increase in the quarter that is just ending.

The Commerce Department reported Wednesday that the gross domestic product, the economy’s total output of goods and services, fell at a rate of 31.4% in the April-June quarter...” Story at...

https://www.cnbc.com/2020/09/30/us-gdp-q2-2020.html


CHICAGO PMI (MarketWatch)

“A measure of business conditions in the Chicago region surged in September to the highest level since the end of 2018, a stronger than expected reading that reflects improvement in manufacturing and the resilience of the broader U.S. economy. The Chicago PMI business barometer jumped to 62.4 in September...” Story at... 

https://www.marketwatch.com/story/business-in-chicago-region-surges-in-september-adds-to-evidence-of-steadily-improving-us-economy-2020-09-30


EIA CRUDE INVENTORIES Energy Information Administration)

“U.S. commercial crude oil inventories (excluding those in the Strategic Petroleum Reserve) decreased by 2.0 million barrels from the previous week. At 492.4 million barrels, U.S. crude oil inventories are about 13% above the five year average for this time of year.” Press release at...

http://ir.eia.gov/wpsr/wpsrsummary.pdf


SOMETHING IS LURKING (MarketWatch)

“Rosenberg [David Rosenburg, Rosenburg Research] thinks recent stock-market choppiness should be a reason to worry. ‘Does this behavior look normal to you?’ he asked. ‘Any reason, you think, for all this volatility? Could it be a signal that something is lurking around the corner?... as we go into fall and then winter, this situation can only get worse. And the market gyrations, as at the turn of the year, are telling you get out of Dodge – as in, de-risk.’” Story at...

https://www.marketwatch.com/story/market-swings-are-a-sign-something-is-lurking-says-strategist-who-called-08-crisis-11601403688?mod=home-page


CORONAVIRUS (NTSM)

Here’s the latest from the COVID19 Johns Hopkins website at 7:30 Wednesday. US total case numbers are on the left axis; daily numbers are on the right side of the graph with the 10-dMA of daily numbers in Green.

MARKET REPORT / ANALYSIS         

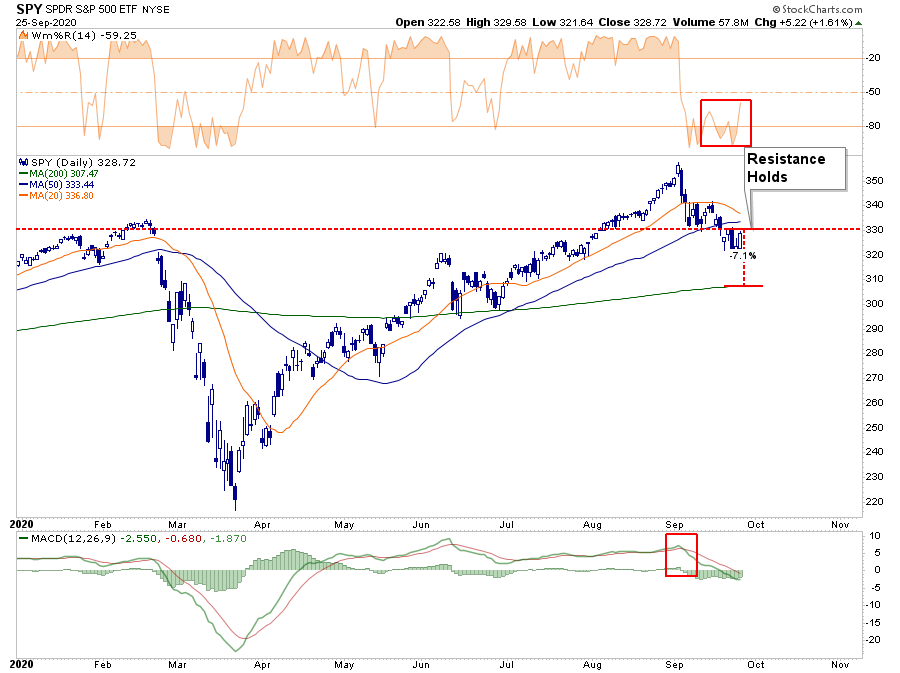
-Wednesday the S&P 500 rose about 0.8% to 3363.

-VIX rose about 0.4% to 26.37.

-The yield on the 10-year Treasury rose to 0.689%.


I was not surprised to see a break above the 50-dMA today. Wall Street likes to create buyers and sell to them when it can. A push above the 50-dMA was guaranteed to find some buyers. Even with the selloff in the afternoon, the Index still closed slightly above its 50-dMA. There may not be much follow-thru. The Pros are selling based on late day action over the last month. I don’t expect a bounce to be above a 50% retracement toward the old highs.


VIX was up today. Not a good sign since the S&P 500 was up nearly 1%.


The cyclical Industrials (XLI-ETF) have been outperforming the S&P 500 for a long time. Now XLI is underperforming the Index; this suggests knowledgeable investors are worried about further recession.


TODAY’S FACTOID

The 40-dMA of new-highs is a good trend indicator with reasonable indications for turning points (assuming that there is not a quick down and back move). It will lag the trend in such cases. Not much question in the current trend signal.

As of today, the S&P 500 is down 6.1% from its all-time high. This is day 19 of the correction. The average time from top to bottom for a correction is 35-days for corrections less than 10% and 68-days for bigger corrections. The 200-dMA is now 3110, 8.1% below today’s close.


The daily sum of 20 Indicators improved from -6 to -1 (a positive number is bullish; negatives are bearish). The 10-day smoothed sum that smooths the daily fluctuations remained -25. (These numbers sometimes change after I post the blog based on data that comes in late.) Most of these indicators are short-term and many are trend following.


The Long Term NTSM indicator ensemble has been HOLD for the last 4 days after a SELL before that. The Sentiment, Volume, Price and VIX Indicators are neutral.


I remain bearish.


MOMENTUM ANALYSIS:

TODAY’S RANKING OF  15 ETFs (Ranked Daily)

The top ranked ETF receives 100%. The rest are then ranked based on their momentum relative to the leading

ETF.

*For additional background on the ETF ranking system see NTSM Page at…

http://navigatethestockmarket.blogspot.com/p/exchange-traded-funds-etf-ranking.html


TODAY’S RANKING OF THE DOW 30 STOCKS (Ranked Daily)

Here’s the revised DOW 30 and its momentum analysis. The top ranked stock receives 100%. The rest are then ranked based on their momentum relative to the leading stock.

For more details, see NTSM Page at…

https://navigatethestockmarket.blogspot.com/p/a-system-for-trading-dow-30-stocks-my_8.html


WEDNESDAY MARKET INTERNALS (NYSE DATA)

Market Internals remained NEGATIVE on the market.

Market Internals are a decent trend-following analysis of current market action, but should not be used alone for short term trading. They are usually right, but they are often late.  They are most useful when they diverge from the Index. 

Using the Short-term indicator in 2018 in SPY would have made a 5% gain instead of a 6% loss for buy-and-hold. The methodology was Buy on a POSITIVE indication and Sell on a NEGATIVE indication and stay out until the next POSITIVE indication. The back-test included 13-buys and 13-sells, or a trade every 2-weeks on average.  

My current stock allocation is about 30% invested in stocks. You may wish to have a higher or lower % invested in stocks depending on your risk tolerance. 30% is a conservative position that I re-evaluate daily, but it is appropriate for the correction.


As a retiree, 50% in the stock market is about fully invested for me – it is a cautious and conservative number. If I feel very confident, I might go to 60%; if this correction is deep enough, 80% would not be out of the question.

Tuesday, September 29, 2020

Consumer Confidence … Contrarians Bullish Due to Sentiment ... Coronavirus (Covid-19) … Stock Market Analysis … ETF Trading … Dow 30 Ranking

“Trade what you see; not what you think.” – The Old Fool, Richard McCranie, trader extraordinaire.


“The big money is not in the buying and selling. But in the waiting.” - Charlie Munger, Vice Chairman, Berkshire Hathaway


CONSUMER CONFIDENCE (MarketWatch)

“Consumer confidence rose in September to the highest level since the coronavirus pandemic began after the number of cases declined and the economic forged ahead, a closely followed survey showed. The index of consumer confidence rose to 101.8 this month from 86.3 in August...” Story at...

https://www.marketwatch.com/story/consumer-confidence-surges-to-highest-level-since-start-of-coronvirus-pandemic-2020-09-29


CONTRARIANS BULLISH DUE TO BEARISH TRADERS (MarketWatch)

“Recent U.S. stock market weakness does not represent the beginning of a new bear market, according to a contrarian analysis of short-term market timers. That’s because those timers have reacted to the market’s recent pullback by rapidly turning bearish. At major tops, in contrast, their typical behavior is to stubbornly hold onto their bullishness.” Story at...

https://www.marketwatch.com/story/why-septembers-selloff-has-these-savvy-traders-convinced-that-stock-prices-are-going-up-2020-09-22?mod=article_inline

My cmt: Interesting, but I don’t see this in my sentiment numbers. Back in December 2018 we had a 20% correction, but when the S&P 500 was down about 10% (as it was last week) the 5-dMA of %-bulls was 83%. When the S&P 500 was down about 10% last week, the %-bulls was the also 83%. It doesn’t appear that sentiment is so low that we can’t fall farther. In my system, I’d have to see sentiment at 65%-bulls before sentiment would be calling a buy. (My Sentiment is measured as a 5-dMA of %-Bulls (Bulls/{bulls+bears}) based on the amounts invested in selected Rydex/Guggenheim mutual funds.)


CORONAVIRUS (NTSM)

Here’s the latest from the COVID19 Johns Hopkins website at 5:45 Tuesday. US total case numbers are on the left axis; daily numbers are on the right side of the graph with the 10-dMA of daily numbers in Green.

MARKET REPORT / ANALYSIS         

-Tuesday the S&P 500 dipped about 0.5% to 3335

-VIX rose about 1% to 26.51.

-The yield on the 10-year Treasury slipped to 0.654%.


For now, it still appears we are in a counter-trend rally, but we failed at a 2nd try to close above the 50-dMA. Rally over? Probably not, but we’ll see.


As of today, the S&P 500 is down 6.9% from its all-time high. This is day 18 of the correction. The average time from top to bottom for a correction is 35-days for corrections less than 10% and 68-days for bigger corrections. The 200-dMA is now 3109, 7.3% below today’s close.


The daily sum of 20 Indicators declined from -2 to -6 (a positive number is bullish; negatives are bearish). The 10-day smoothed sum that smooths the daily fluctuations declined from -16 to -25. (These numbers sometimes change after I post the blog based on data that comes in late.) Most of these indicators are short-term and many are trend following.


The Long Term NTSM indicator ensemble has been HOLD for the last 3 days after a SELL before that. The Volume Indicator is bearish. Price and VIX Indicators are neutral.


I remain bearish.


MOMENTUM ANALYSIS:

TODAY’S RANKING OF  15 ETFs (Ranked Daily)

The top ranked ETF receives 100%. The rest are then ranked based on their momentum relative to the leading ETF. 

*For additional background on the ETF ranking system see NTSM Page at…

http://navigatethestockmarket.blogspot.com/p/exchange-traded-funds-etf-ranking.html


TODAY’S RANKING OF THE DOW 30 STOCKS (Ranked Daily)

Here’s the revised DOW 30 and its momentum analysis. The top ranked stock receives 100%. The rest are then ranked based on their momentum relative to the leading stock.

For more details, see NTSM Page at…

https://navigatethestockmarket.blogspot.com/p/a-system-for-trading-dow-30-stocks-my_8.html


TUESDAY MARKET INTERNALS (NYSE DATA)

Market Internals switched to NEGATIVE on the market.

Market Internals are a decent trend-following analysis of current market action, but should not be used alone for short term trading. They are usually right, but they are often late.  They are most useful when they diverge from the Index. 

Using the Short-term indicator in 2018 in SPY would have made a 5% gain instead of a 6% loss for buy-and-hold. The methodology was Buy on a POSITIVE indication and Sell on a NEGATIVE indication and stay out until the next POSITIVE indication. The back-test included 13-buys and 13-sells, or a trade every 2-weeks on average.  

My current stock allocation is about 30% invested in stocks. You may wish to have a higher or lower % invested in stocks depending on your risk tolerance. 30% is a conservative position that I re-evaluate daily, but it is appropriate for the correction.


As a retiree, 50% in the stock market is about fully invested for me – it is a cautious and conservative number. If I feel very confident, I might go to 60%; if this correction is deep enough, 80% would not be out of the question.

Monday, September 28, 2020

Selloff Overdone - Correction May Not Be … Coronavirus (Covid-19) … Stock Market Analysis … ETF Trading … Dow 30 Ranking

“Trade what you see; not what you think.” – The Old Fool, Richard McCranie, trader extraordinaire.


“The big money is not in the buying and selling. But in the waiting.” - Charlie Munger, Vice Chairman, Berkshire Hathaway


SELLOFF OVERDONE – THE CORRECTION MAY NOT BE (Real Investment Advice, excerpt)

“In the chart below, we see the market rallied back to the previous consolidation lows with the 20-dma approaching a cross of the 50-dma. Such would suggest more downward pressure on prices short-term. The 200-dma is roughly 7% lower from Friday’s close. 

If the market can break above resistance on Monday, clear the 50- and 20-dma’s, then old highs should not be an issue.

But that will take a fair bit of work at a time where market risks have increased.” – Lance Roberts

Commentary at...

https://realinvestmentadvice.com/the-sell-off-is-overdone-the-correction-may-not-be-09-25-20/


CORONAVIRUS (NTSM)

Here’s the latest from the COVID19 Johns Hopkins website at 5:00 Monday. US total case numbers are on the left axis; daily numbers are on the right side of the graph with the 10-dMA of daily numbers in Green.

MARKET REPORT / ANALYSIS         

-Monday the S&P 500 rose about 1.6% to 3352.

-VIX fell about 0.7% to 26.19. (That’s very small for such a big move higher in the S&P 500; Options Players are unimpressed by the rally.)

-The yield on the 10-year Treasury rose to 0.661%.


Regular readers know that I track the number of days that the S&P 500 closed in positive territory (up-days) over given time-periods as indicators of overbought conditions. At the recent top on 2 September, 9 out of the 10 previous trading days were up-days. That’s a bearish sign suggesting some sort of pullback.  We also noted that over a 20-day period, 16-days were up days.  That is a more intense bear sign and it occurred 3 days before the recent top. We saw these signs at the top of the 7% decline in May 2019.


There is another time-period I track that rarely gives a signal. I have not seen it in a decade. When 67 days out of the past 100 are up-days, it is a very bearish sign. It has only signaled once in the past 10 years, the day before the top of a 16% correction in 2010. Since 67 up-days are rare, I checked to see when 66 days were up out of 100. Those 66 numbers were clustered, again, at the top in 2010...and at the recent 2 Sept Top.


Since a sample size of 1 doesn’t mean much, we should consider this along with 2 other bear-signs that signal tops of larger corrections: (1) the S&P 500 was 16% above its 200-dMA at the 2 Sept top; (2) the % of issues advancing at several of the recent tops was only 2.2%. 


These all suggest that the current correction is likely to be fall at least to the 200-dMA. That doesn’t mean that it will – just that the likelihood is higher than in most corrections.


For now, it appears we are in a counter-trend rally. So far, we have retraced back to 0.1% below the 50-dMA, and about 33% of the total drop from the prior high. A 50% retracement would be not be a surprise before selling resumes.


As of today, the S&P 500 is down 6.4% from its all-time high. This is day 17 of the correction. The average time from top to bottom for a correction is 35-days for corrections less than 10% and 68-days for bigger corrections. The 200-dMA is now 3107, 7.8% below today’s close.


The daily sum of 20 Indicators improved from -4 to -2 (a positive number is bullish; negatives are bearish). The 10-day smoothed sum that smooths the daily fluctuations improved from -22 to -16. (These numbers sometimes change after I post the blog based on data that comes in late.) Most of these indicators are short-term and many are trend following.


I remain bearish.


MOMENTUM ANALYSIS:

TODAY’S RANKING OF  15 ETFs (Ranked Daily)

The top ranked ETF receives 100%. The rest are then ranked based on their momentum relative to the leading ETF.

*For additional background on the ETF ranking system see NTSM Page at…

http://navigatethestockmarket.blogspot.com/p/exchange-traded-funds-etf-ranking.html


TODAY’S RANKING OF THE DOW 30 STOCKS (Ranked Daily)

Here’s the revised DOW 30 and its momentum analysis. The top ranked stock receives 100%. The rest are then ranked based on their momentum relative to the leading stock.

For more details, see NTSM Page at…

https://navigatethestockmarket.blogspot.com/p/a-system-for-trading-dow-30-stocks-my_8.html


MONDAY MARKET INTERNALS (NYSE DATA)

Market Internals improved to NEUTRAL on the market.

Market Internals are a decent trend-following analysis of current market action, but should not be used alone for short term trading. They are usually right, but they are often late.  They are most useful when they diverge from the Index. 

Using the Short-term indicator in 2018 in SPY would have made a 5% gain instead of a 6% loss for buy-and-hold. The methodology was Buy on a POSITIVE indication and Sell on a NEGATIVE indication and stay out until the next POSITIVE indication. The back-test included 13-buys and 13-sells, or a trade every 2-weeks on average.  


My current stock allocation is about 30% invested in stocks. You may wish to have a higher or lower % invested in stocks depending on your risk tolerance. 30% is a conservative position that I re-evaluate daily, but it is appropriate for the correction.


As a retiree, 50% in the stock market is about fully invested for me – it is a cautious and conservative number. If I feel very confident, I might go to 60%; if this correction is deep enough, 80% would not be out of the question.

Friday, September 25, 2020

Durable Orders … Looking for a Bounce (Short-term) ... Coronavirus (Covid-19) … Stock Market Analysis … ETF Trading … Dow 30 Ranking

“Trade what you see; not what you think.” – The Old Fool, Richard McCranie, trader extraordinaire.


“The big money is not in the buying and selling. But in the waiting.” - Charlie Munger, Vice Chairman, Berkshire Hathaway


DURABLE ORDERS (Marketwatch)

“Orders for durable goods rose 0.4% in August, the fourth straight gain but a more modest increase after three straight strong gains, the government said Friday... “The muted 0.4% rise in orders last month signals...that activity is now more closely aligned with the soft pace of underlying economic activity that has lost significant momentum since the initial stages of the recovery,” said Oren Klachkin, lead U.S economist at Oxford Economics.” Story at...

https://www.marketwatch.com/story/durable-goods-orders-rise-modest-04-in-august-2020-09-25


LOOKING FOR A BOUNCE (Heritage Capital)

“The NASDAQ 100 which led the way down forged its lowest price on September 21. The other four major stock market indices saw their lows on September 24. That’s the first clue that something may be changing, at least in the very, very short-term which is how trends begin. I don’t want to read too much into it just yet...If I had my way, stocks would bounce for a few days or so, maybe longer, and then head down to new lows in mid to late October, but bottom well before the election when the masses will be in panic mode because Trump or Biden may win. Or, no one wins and it ends up in the Supreme Court or on Nancy Pelosi’s desk.” – Paul Schatz, President, Heritage Capital.  Commentary at...

https://investfortomorrow.com/blog/looking-for-a-bounce-now/


HOW ABOUT SOME GOOD NEWS FOR A CHANGE


CORONAVIRUS (NTSM)

Here’s the latest from the COVID19 Johns Hopkins website at 5:10 Friday. US numbers are on the left axis; daily numbers are on the right side of the graph with the 10-dMA of daily numbers in Green.


MARKET REPORT / ANALYSIS         

-Friday the S&P 500 rose about 1.6% to 3298.

-VIX fell about 7% to 26.38.

-The yield on the 10-year Treasury slipped to 0.658%.


As of today, the S&P 500 is down 7.9% from its all-time high. This is day 16 of the correction. The average time from top to bottom for a correction is 35-days for corrections less than 10% and 68-days for bigger corrections. The 200-dMA is now 3107, 6.2% below today’s close.


The daily sum of 20 Indicators declined from -2 to -4 (a positive number is bullish; negatives are bearish). The 10-day smoothed sum that smooths the daily fluctuations improved from -26 to -22. (These numbers sometimes change after I post the blog based on data that comes in late.) Most of these indicators are short-term and many are trend following.


Here’s the Friday run-down of some important indicators. These tend to be both long-term and short-term so they are somewhat different than the 20 that I report on daily.


BULL SIGNS

-The 50-dMA and the 100-dMA of the % of stocks advancing on the NYSE (Breadth) are above 50%.

-Cyclical Industrials (XLI-ETF) are outperforming the S&P 500.

-The S&P 500 is still outperforming the Utilities ETF (XLU).


NEUTRAL

-Statistically, the S&P 500 gave a panic-signal, 3 September. A panic signal usually suggests more to come.  (This signal remains in effect for 7-trading days.)

-Overbought/Oversold Index, a measure of advance-decline data is neutral.

-Non-crash Sentiment indicator remains neutral.

-The Fosback High-Low Logic Index is neutral.

-There have been 10 up-days over the last 20 days. Neutral

-We’ve seen 5 up-days over the last 10-days. Neutral

-Bollinger Bands – close to bullish, but still neutral.

-RSI was oversold Thursday, but is now neutral.

-Breadth on the NYSE vs the S&P 500 index is neutral.

-The S&P 500 is 6% above its 200-dMA. When Sentiment is considered, the signal is also neutral.

-VIX gave a sell-signal Thursday, but switched to Hold Friday.

-The size of up-moves has been smaller than the size of down-moves over the last month, but not enough to give a signal.

-The Smart Money (late-day action) is mixed. This indicator is based on the Smart Money Indicator (a variant of the indicator developed by Don Hayes).


BEAR SIGNS

-MACD of stocks advancing on the NYSE (breadth) made a bearish crossover 21 Sept.

-The smoothed advancing volume on the NYSE is moving lower.

-The 5-10-20 Timer System is sell; for now the 5-dEMA and the 10-dEMA are below the 20-dEMA. 

-MACD of S&P 500 price made a bearish crossover 4 September.

-The 10-dMA of stocks advancing on the NYSE (Breadth) is below 50%.

-Long-term new-high/new-low data.

-Short-term new-high/new-low data.

-Only 2.3% of all issues traded on the NYSE made new, 52-week highs when the S&P 500 made new all-time-highs. (This stays in the negative column until we make a new high.)

-My Money Trend indicator.

-47% of the 15-ETFs that I track have been up over the last 10-days – neutral.


On Friday, 21 February, 2 days after the top of the Coronavirus pullback, there were 10 bear-signs and 1 bull-sign. Now there are 10 bear-signs and 3 bull-signs. Last week, there were 8 bear-signs and 5 bull-signs.


I remain bearish.


MOMENTUM ANALYSIS:

TODAY’S RANKING OF  15 ETFs (Ranked Daily)

The top ranked ETF receives 100%. The rest are then ranked based on their momentum relative to the leading ETF. 

*For additional background on the ETF ranking system see NTSM Page at…

http://navigatethestockmarket.blogspot.com/p/exchange-traded-funds-etf-ranking.html


TODAY’S RANKING OF THE DOW 30 STOCKS (Ranked Daily)

Here’s the revised DOW 30 and its momentum analysis. The top ranked stock receives 100%. The rest are then ranked based on their momentum relative to the leading stock.

For more details, see NTSM Page at…

https://navigatethestockmarket.blogspot.com/p/a-system-for-trading-dow-30-stocks-my_8.html


FRIDAY MARKET INTERNALS (NYSE DATA)

Market Internals declined to NEGATIVE on the market.

Market Internals are a decent trend-following analysis of current market action, but should not be used alone for short term trading. They are usually right, but they are often late.  They are most useful when they diverge from the Index. 

Using the Short-term indicator in 2018 in SPY would have made a 5% gain instead of a 6% loss for buy-and-hold. The methodology was Buy on a POSITIVE indication and Sell on a NEGATIVE indication and stay out until the next POSITIVE indication. The back-test included 13-buys and 13-sells, or a trade every 2-weeks on average.  

My current stock allocation is about 30% invested in stocks. You may wish to have a higher or lower % invested in stocks depending on your risk tolerance. 30% is a conservative position that I re-evaluate daily, but it is appropriate for the correction.


As a retiree, 50% in the stock market is about fully invested for me – it is a cautious and conservative number. If I feel very confident, I might go to 60%; if this correction is deep enough, 80% would not be out of the question.

Thursday, September 24, 2020

Jobless Claims ... New Home Sales ... ATA Truck Tonnage Fell ... Shocking Chart More Downside Ahead … Coronavirus (Covid-19) … Stock Market Analysis … ETF Trading … Dow 30 Ranking

“Trade what you see; not what you think.” – The Old Fool, Richard McCranie, trader extraordinaire.


“The big money is not in the buying and selling. But in the waiting.” - Charlie Munger, Vice Chairman, Berkshire Hathaway


JOBLESS CLAIMS (CNBC)

“The number of first-time filers for unemployment benefits were slightly higher than expected last week as the labor market continues its sluggish recovery from the coronavirus pandemic.

The Labor Department reported Thursday that initial jobless claims for the week ending Sept. 19 came in at 870,000...” Story at...

https://www.cnbc.com/2020/09/24/weekly-jobless-claims.html


NEW HOME SALES (MarketWatch)

“Sales of new single-family homes in August exceeded an annual rate of 1 million for the first time since 2006...Compared with last year, new home sales are up 43%.” Story at...

https://www.marketwatch.com/story/new-home-sales-surge-to-highest-level-since-before-the-great-recession-as-buyers-are-pushed-into-the-construction-market-2020-09-24


ATA TRUCK TONNAGE FELL IN AUGUST (American Trucking Association)

“American Trucking Associations’ advanced seasonally adjusted (SA) For-Hire Truck Tonnage Index decreased 5.6% in August after declining 1.4% in July. In August, the index equaled 107.5 (2015=100) compared with 113.9 in July.

“The August softness suggests that freight is very uneven in the trucking industry,” said ATA Chief Economist Bob Costello... Compared with August 2019, the SA index contracted 8.9%, the fifth straight year-over-year decline.” Press release at...

https://www.trucking.org/news-insights/ata-truck-tonnage-index-fell-56-august

This is not good since it may suggest a slowing economy.


STUNNING SHOCKING CHART CAUSES WORRY (Marketwatch)

“Is history repeating itself? Check out this chart, courtesy of Mott Capital’s Michael Kramer, comparing the Nasdaq-100 NDX, -3.15% back then to the same tech-heavy index today:

“I found this to be stunning and shocking,” Kramer told investors in a blog post. “I hope this turns out to be wrong, by the way.” More than just the chart, the numbers he highlighted this week mirror of the action in 1999 almost exactly.” Commentary at...

https://www.marketwatch.com/story/this-stunning-and-shocking-chart-has-one-wall-street-strategist-worried-about-the-stock-markets-next-move-11600874025?mod=home-page


MORE DOWNSIDE AHEAD (Heritage Capital)

“Monday’s action saw the NASDAQ 100 close up on the day, but the NASDAQ had four times the number of stocks going down than going up. That’s not healthy behavior and continues to show what I have been warning about since mid-July; there are many cracks in the foundation that need repair. While nowhere near as egregious, this is what we saw in late 1999 and early 2000 before the Dotcom Bubble burst.”  Commentary at...

https://investfortomorrow.com/blog/market-finds-temp-low-on-schedule-but-more-downside-ahead/


CORONAVIRUS (NTSM)

Here’s the latest from the COVID19 Johns Hopkins website at 5:00 Thursday. Total US numbers are on the left axis; daily numbers are on the right side of the graph with the 10-dMA of daily numbers in Green.


MARKET REPORT / ANALYSIS         

-Thursday the S&P 500 rose about 0.3% to 3247.

-VIX rose about 6% to 28.83.

-The yield on the 10-year Treasury slipped to 0.669%.


As of today, the S&P 500 is down 9.3% from its all-time high. This is day 15 of the correction. The average time from top to bottom for a correction is 35-days for corrections less than 10% and 68-days for bigger corrections. The 200-dMA is now 3106, 4.5% lower than today’s close.


The daily sum of 20 Indicators improved from -4 to -2 (a positive number is bullish; negatives are bearish). The 10-day smoothed sum that smooths the daily fluctuations improved from -33 to -26. (These numbers sometimes change after I post the blog based on data that comes in late.) Most of these indicators are short-term and many are trend following.


RSI switched to Neutral today, so while we may be getting closer to a bounce, there aren’t any indicators saying bounce now. 


The Long Term NTSM indicator ensemble returned to SELL. The Price, Volume and VIX Indicators are bearish. The Long term NTSM indicator switched to SELL 3 days after the recent top, but I have been surprised that it took so long for the VIX indicator to join the Bear Party. VIX may be warning that this drop has a lot more room to fall.


I remain bearish.


MOMENTUM ANALYSIS:

TODAY’S RANKING OF  15 ETFs (Ranked Daily)

The top ranked ETF receives 100%. The rest are then ranked based on their momentum relative to the leading ETF. 

*For additional background on the ETF ranking system see NTSM Page at…

http://navigatethestockmarket.blogspot.com/p/exchange-traded-funds-etf-ranking.html


TODAY’S RANKING OF THE DOW 30 STOCKS (Ranked Daily)

Here’s the revised DOW 30 and its momentum analysis. The top ranked stock receives 100%. The rest are then ranked based on their momentum relative to the leading stock.


For more details, see NTSM Page at…

https://navigatethestockmarket.blogspot.com/p/a-system-for-trading-dow-30-stocks-my_8.html


THURSDAY MARKET INTERNALS (NYSE DATA)

Market Internals improved to NEUTRAL on the market.

Market Internals are a decent trend-following analysis of current market action, but should not be used alone for short term trading. They are usually right, but they are often late.  They are most useful when they diverge from the Index. 


Using the Short-term indicator in 2018 in SPY would have made a 5% gain instead of a 6% loss for buy-and-hold. The methodology was Buy on a POSITIVE indication and Sell on a NEGATIVE indication and stay out until the next POSITIVE indication. The back-test included 13-buys and 13-sells, or a trade every 2-weeks on average.  

My current stock allocation is about 30% invested in stocks. You may wish to have a higher or lower % invested in stocks depending on your risk tolerance. 30% is a conservative position that I re-evaluate daily, but it is appropriate for the correction.


As a retiree, 50% in the stock market is about fully invested for me – it is a cautious and conservative number. If I feel very confident, I might go to 60%; if this correction is deep enough, 80% would not be out of the question.