“Trade what you see; not what you think.” – The Old Fool,
Richard McCranie, trader extraordinaire.
“Far
more money has been lost by investors in preparing for corrections, or
anticipating corrections, than has been lost in the corrections themselves.” -
Peter Lynch, former manager of Fidelity’s Magellan® fund.
CONSUMER CONFIDENCE (Conference Board)
“The Conference Board Consumer Confidence Index® deteriorated for the third
consecutive month in April, retreating to 97.0 (1985=100) from a downwardly
revised 103.1 in March. Despite these three months of weakness, the gauge
continues to move sideways within a relatively narrow range that’s largely held
steady for more than two years.” Story at...
https://www.conference-board.org/topics/consumer-confidence
CHICAGO PMI (RTT News)
“The report said the Chicago business barometer slipped
to 46.0 in January from an upwardly revised 47.2 in December, with a reading
below 50 indicating a contraction.”
https://www.rttnews.com/3420745/chicago-business-barometer-unexpectedly-indicates-faster-contraction-in-january.aspx
EMPLOYMENT COST INDEX (CNN)
“A closely watched measure of labor costs showed that
compensation growth accelerated much faster than expected during the first
three months of the year, providing an unwelcome data point for Federal Reserve
officials looking for inflation pressures to ease. The Employment Cost Index
(ECI) rose a seasonally adjusted 1.2% last quarter, faster growth than
the 0.9%
increase the prior quarter...” Story at...
https://www.cnn.com/2024/04/30/economy/employment-cost-index-eci-wages-q1/index.html
MARKET REPORT / ANALYSIS
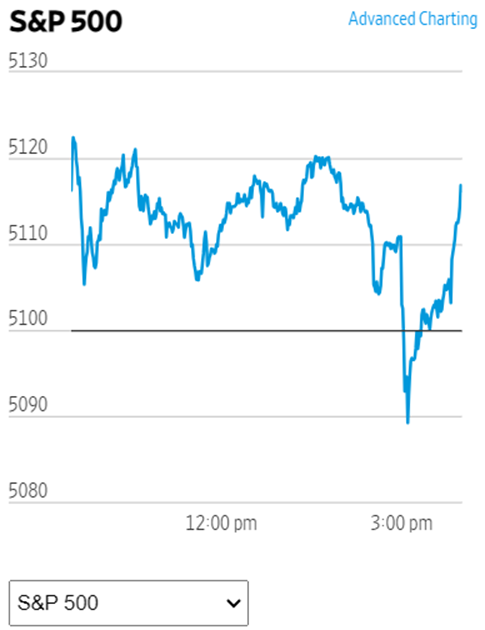
-Tuesday the S&P 500 fell about 1.6%% to 5036.
-VIX rose about 7% to 15.65.
-The yield on the 10-year Treasury rose to 4.682%.
MY TRADING POSITIONS:
QLD – Added 4/29/2024
SSO – Added 4/29/2024.
XLE – Added 4/24/2024
XLK – Technology ETF (holding since the October 2022
lows). I don’t want to pay taxes on this gain, so I am holding this position.
CRM – Added 1/22/2024
DWCPF - Dow Jones U.S. Completion Total Stock Market
Index. – Added 12/7/2023 when I sold the S&P 500.
“The Dow Jones U.S. Completion Total Stock Market Index,
also known as the DWCPF, is a widely used financial index that provides a
comprehensive measure of the US equity market. The DWCPF includes all US stocks
that are not included in the Dow Jones US Total Stock Market Index, which
comprises large-cap and mid-cap companies. As a result, the DWCPF provides a
complete picture of the US stock market, including small-cap and micro-cap
companies, which are often overlooked by other indexes.” From...
https://fi.money/blog/posts/what-is-dow-jones-u-s-completion-total-stock-market-index-dwcpf
CURRENT SUMMARY OF APPROXIMATELY 50 INDICATORS:
The Bull/Bear Spread (Bulls minus Bears) slipped to
Neutral with 11 Bear-signs and 11-Bull. (The rest are neutral. It is normal to
have a lot of neutral indicators since many of those are top or bottom
indicators that will signal only at extremes.) The chart below continues to
look bullish. The 10-dMA of the 50 Indicator Spread (Bulls minus Bears - purple line) is
clearly moving higher. That is
associated with a rising S&P 500.
TODAY’S COMMENT:
Markets were weak all day
and closed very near their lows. It’s just one day though. Markets are spooked by the Fed meeting Wed
and Thursday and the weaker than expected data we’ve seen rececntly. There’s still talk about the low GDP number.
The experts have pointed out that it was low due to volitile data associated with
imports and exports. Those numbers are expected to improved and the next
GDP number should improve handily.
Tuesday was a statistically significant down-day. That
just means that the price-volume move exceeded my statistical parameters.
Statistics show that a statistically-significant, down-day is followed by an
up-day about 60% of the time. Bottoms occur on statistically-significant, down-days,
since they tend to be flush out days that shake out weak hands; but not all statistically-significant,
down-days are bottoms.
LONG-TERM INDICATOR: The Long Term NTSM indicator
remained HOLD: VOLUME, VIX, PRICE & SENTIMENT are neutral.
(The Long-Term Indicator is not a good top-indicator. It
can signal BUY at a top.)
(The important major BUY in this indicator was on 21
October 2022, 7-days after the bear-market bottom. For my NTSM overall signal,
I suggested that a short-term buying opportunity occurred on 27 September
(based on improved market internals on the retest), although without market
follow-thru, I was unwilling to call a buy; however, I did close shorts and
increased stock holdings. I issued a Buy-Signal on 4 October, 6-days before the
final bottom, based on stronger market action that confirmed the market
internals signal. The NTSM sell-signal was issued 21 December, 9 sessions
before the high of this recent bear market, based on the bearish “Friday Rundown”
of indicators.)
BOTTOM LINE
The pullback is over, but the S&P 500 could always
retest its low. That’s my story and I’m sticking with it.
ETF - MOMENTUM ANALYSIS:
TODAY’S RANKING OF 15 ETFs (Ranked Daily) ETF ranking
follows:
The top ranked ETF receives
100%. The rest are then ranked based on their momentum relative to the leading
ETF.
*For additional background on
the ETF ranking system see NTSM Page at…
http://navigatethestockmarket.blogspot.com/p/exchange-traded-funds-etf-ranking.html
DOW STOCKS - TODAY’S MOMENTUM RANKING
OF THE DOW 30 STOCKS (Ranked Daily)
DOW 30 momentum ranking
follows:
The top ranked Stock receives
100%. The rest are then ranked based on their momentum relative to the leading Stock.
For more details, see NTSM
Page at…
https://navigatethestockmarket.blogspot.com/p/a-system-for-trading-dow-30-stocks-my_8.html
TUESDAY MARKET INTERNALS (NYSE
DATA)
My basket of Market Internals remained BUY. (My basket of Market
Internals is a decent trend-following analysis of current market action, but
should not be used alone for short term trading. They are most useful when they
diverge from the Index.)
...My current invested
position is about 70% stocks, including stock mutual funds and ETFs. I’m
usually about 50% invested in stocks, so this is a bullish, over-invested
position.
I trade about 15-20% of the total portfolio using the
momentum-based analysis I provide here. When I see a definitive bottom, I add a
lot more stocks to the portfolio, usually by using an S&P 500 ETF as I did
back in October 22 and 23.
“Trade what you see; not what you think.” – The Old Fool,
Richard McCranie, trader extraordinaire.
“Far more
money has been lost by investors in preparing for corrections, or anticipating
corrections, than has been lost in the corrections themselves.” -
Peter Lynch, former manager of Fidelity’s Magellan® fund.
“Law enforcement officials arrested 57 protesters during
Wednesday’s event organized by the Palestine Solidarity Committee after
participants refused to disperse despite demands from authorities and the
university [of Texas at Austin]. Of those arrested, 26 were neither students
nor faculty of the university, according to officials at UT-Austin.” – Epoch
Times via ZeroHedge at...
https://www.zerohedge.com/political/nearly-half-those-arrested-ut-austin-pro-palestinian-protest-had-no-links-school
"For anyone who understands the role of the free
press in a democracy, it should be troubling that President Biden has so
actively and effectively avoided questions from independent journalists during
his term. The president occupies the most important office in our nation, and
the press plays a vital role in providing insights into his thinking and
worldview, allowing the public to assess his record and hold him to account.
Mr. Biden has granted far fewer press conferences and sit-down interviews with
independent journalists than virtually all of his predecessors.” – NY Times
Peasant Woman: Well, how’d
you become king, then?
King Arthur: The Lady of the
Lake, her arm clad in the purest shimmering samite, held aloft Excalibur from
the bosom of the water, signifying by divine providence that I, Arthur, was to
carry Excalibur. That is why I am your king.
Dennis: Listen. Strange
women lying in ponds distributing swords is no basis for a system of
government. Supreme executive power derives from a mandate from the masses, not
from some farcical aquatic ceremony.
Given the choices this election
cycle, we might be better off with a Lady of the Lake.
From Michael Ramirez, political commentary at...
https://michaelpramirez.com/index.html
CRIMINAL CASES AGAINST TRUMP (US News and World Report)
“Indictment 1: Hush Money
Trump’s first indictment on March 30, 2023, centered
around his role in reimbursing his former attorney, Michael Cohen, for paying
off porn star Stormy Daniels in 2016 to keep her quiet about what she says was
an extramarital affair she had with Trump a decade earlier...[charged with]...
falsifying business records...
Indictment 2: Classified Documents
The former president’s second indictment came on June 9,
when a grand jury accused him of illegally retaining classified information
after he left office, showing some of those documents to individuals without
proper clearance and hatching a plan to hide the materials from officials in
defiance of a federal subpoena...[charged with]... willful retention of
national defense information, conspiracy to obstruct justice, withholding a
document or record, corruptly concealing a document or record, concealing a document
in a federal investigation, scheme to conceal and making false statements...
Indictment 3: 2020 Election
A federal grand jury handed up Trump’s third indictment
on Aug. 1 in connection with what prosecutors say were efforts to overturn the
results of his 2020 election loss and undermine America’s democracy...[ charged
with]... one count of conspiracy to defraud the United States, one count of
conspiracy to obstruct an official proceeding, one count of obstruction of and
attempt to obstruct an official proceeding, and one count of conspiracy against
rights....
Indictment 4: Georgia RICO and Conspiracy
Trump’s fourth indictment came late on Aug. 14, when a
grand jury accused him and more than a dozen of his allies of orchestrating a
massive criminal enterprise to overturn the results of the 2020 presidential
election in Georgia... Trump attorneys Jenna Ellis, Sidney Powell and Kenneth
Chesebro and Atlanta-based bail bondsman Scott Hall have pleaded guilty in the
case and were given reduced sentences in exchange for their cooperation with
prosecutors... Trump faced 13 charges, including a violation of the state
racketeering law, or RICO, solicitation of violation of oath by public officer,
conspiracy to commit impersonating a public officer, conspiracy to commit
forgery, conspiracy to commit false statements and writings, committing false
statements and writings, conspiracy to commit filing false documents and filing
false documents.” Story at...
https://www.usnews.com/news/national-news/articles/2023-08-15/explainer-trumps-four-indictments
My cmt: There was a lot more detail in the interesting
read.
Trump has already been found guilty in one case (not
listed above; it’s not a criminal case).
“Judge Arthur Engoron, ruling in a civil lawsuit brought by New York Attorney General
Letitia James, found that Trump and his company deceived banks, insurers and
others by massively overvaluing his assets and exaggerating his net worth on
paperwork used in making deals and securing loans.” For details see...
https://apnews.com/article/donald-trump-letitia-james-fraud-lawsuit-1569245a9284427117b8d3ba5da74249
The MAGA crowd claims these cases are all about
“weaponizing” Government against poor, mistreated Donald.
“Never underestimate the power of stupid people in large
groups." – George Carlin
The NY cases are questionable. Any one of the other three
should put Trump in prison.
MARKET REPORT / ANALYSIS
-Monday the S&P 500 improved about 0.3% to 5116.
-VIX declined about 2% to 14.67.
-The yield on the 10-year Treasury declined to 4.612%.
MY TRADING POSITIONS:
QLD – Added 4/29/2024
SSO – Added 4/29/2024.
XLE – Added 4/24/2024
XLK – Technology ETF (holding since the October 2022
lows). I don’t want to pay taxes on this gain, so I am holding this position.
CRM – Added 1/22/2024
DWCPF - Dow Jones U.S. Completion Total Stock Market
Index. – Added 12/7/2023 when I sold the S&P 500.
“The Dow Jones U.S. Completion Total Stock Market Index,
also known as the DWCPF, is a widely used financial index that provides a
comprehensive measure of the US equity market. The DWCPF includes all US stocks
that are not included in the Dow Jones US Total Stock Market Index, which
comprises large-cap and mid-cap companies. As a result, the DWCPF provides a
complete picture of the US stock market, including small-cap and micro-cap
companies, which are often overlooked by other indexes.” From...
https://fi.money/blog/posts/what-is-dow-jones-u-s-completion-total-stock-market-index-dwcpf
CURRENT SUMMARY OF APPROXIMATELY 50 INDICATORS:
The Bull/Bear Spread (Bulls minus Bears) continues to improve
and Monday it turned bullish. The Summary is now 8 Bear-signs and 14-Bull. (The
rest are neutral. It is normal to have a lot of neutral indicators since many
of those are top or bottom indicators that will signal only at extremes.) The
chart below continues to look bullish. The 10-dMA of the 50 Indicator Spread
(Bulls minus Bears) has been bottoming and again today, it moved higher.
TODAY’S COMMENT:
Today, markets reacted to news in the afternoon that the
Treasury Department was going to borrow about $41B more than expected next
quarter. This is a worry – the National Debt is now impacting stock markets. As
always, I’ll be watching the markets closely.
If the National Debt begins to affect stock market sentiment, we could
be in for real trouble. For now, markets are looking ok. We are coming off a
25% bear market that ended two years ago.
It would be unusual to see a crash now, and indicators don’t support it;
I am following indicators.
As much as we’d like to pretend otherwise, Indicators don’t
predict the future. They give a snapshot of current market conditions and
trend. For now, the trend is up.
Market indicators suggest that the pullback is over. Market action over the last 2 days is
confirming that conclusion. Could the markets reverse back down? Sure, that’s
always possible, but Indicators are bullish and more are on the verge of turning
bullish.
LONG-TERM INDICATOR: The Long Term NTSM indicator remained
HOLD: VOLUME, VIX, PRICE & SENTIMENT are neutral.
(The Long-Term Indicator is not a good top-indicator. It
can signal BUY at a top.)
(The important major BUY in this indicator was on 21
October 2022, 7-days after the bear-market bottom. For my NTSM overall signal,
I suggested that a short-term buying opportunity occurred on 27 September
(based on improved market internals on the retest), although without market
follow-thru, I was unwilling to call a buy; however, I did close shorts and
increased stock holdings. I issued a Buy-Signal on 4 October, 6-days before the
final bottom, based on stronger market action that confirmed the market internals
signal. The NTSM sell-signal was issued 21 December, 9 sessions before the high
of this recent bear market, based on the bearish “Friday Rundown” of
indicators.)
BOTTOM LINE
I think the pullback is over. I bought SSO and QLD.
ETF - MOMENTUM ANALYSIS:
TODAY’S RANKING OF 15 ETFs (Ranked Daily) ETF ranking
follows:
The top ranked ETF receives
100%. The rest are then ranked based on their momentum relative to the leading
ETF.
*For additional background on
the ETF ranking system see NTSM Page at…
http://navigatethestockmarket.blogspot.com/p/exchange-traded-funds-etf-ranking.html
DOW STOCKS - TODAY’S MOMENTUM RANKING
OF THE DOW 30 STOCKS (Ranked Daily)
DOW 30 momentum ranking
follows:
The top ranked Stock receives
100%. The rest are then ranked based on their momentum relative to the leading Stock.
For more details, see NTSM
Page at…
https://navigatethestockmarket.blogspot.com/p/a-system-for-trading-dow-30-stocks-my_8.html
MONDAY MARKET INTERNALS (NYSE
DATA)
My basket of Market Internals remained BUY. (My basket of Market
Internals is a decent trend-following analysis of current market action, but
should not be used alone for short term trading. They are most useful when they
diverge from the Index.)
...My current invested
position is about 70% stocks, including stock mutual funds and ETFs. I’m
usually about 50% invested in stocks, so this is a bullish, over-invested
position.
I trade about 15-20% of the total portfolio using the
momentum-based analysis I provide here. When I see a definitive bottom, I add a
lot more stocks to the portfolio, usually by using an S&P 500 ETF as I did
back in October 22 and 23.
“Trade what you see; not what you think.” – The Old Fool,
Richard McCranie, trader extraordinaire.
“Far
more money has been lost by investors in preparing for corrections, or
anticipating corrections, than has been lost in the corrections themselves.” -
Peter Lynch, former manager of Fidelity’s Magellan® fund.
"I’ve worked with Bette Davis, John Wayne, Jimmy
Stewart, Henry Fonda. Here’s the thing they all have in common: They all, even
in their 70s, worked a little harder than everyone else.” - Ron Howard
"This tells you all you need to know about today's
Republican National Committee: The person in charge of election integrity for
the GOP was just indicted in Arizona for lack of election integrity." –
Liz Cheney, former Republican Congresswoman.
ANOTHER ONE BITES THE DUST (CNN)
“The Gateway Pundit, the notorious far-right
blog and prolific publisher of conspiracy theories, said Wednesday that it had
filed for bankruptcy protection as it grapples with litigation related to its
coverage of the 2020 election. The move comes as
the staunchly pro-Donald Trump website, which promoted the false
notion that the 2020 election was stolen by President Joe Biden and his allies,
faces multiple lawsuits over its bogus claims.” Story at...
https://www.cnn.com/2024/04/24/media/gateway-pundit-declares-bankruptcy/index.html
THEY’RE SO GOOD, NO ONE WANTS TO BUY ONE
“Ford’s electric vehicle unit reported that losses soared
in the first quarter to $1.3 billion, or $132,000 for each of the 10,000
vehicles it sold in the first three months of the year, helping to drag down earnings
for the company overall.” Story at...
https://www.cnn.com/2024/04/24/business/ford-earnings-ev-losses/index.html
CORE PCE (CNBC)
“The personal consumption expenditures price index
excluding food and energy increased 2.8% from a year ago in March, the same as
in February, the Commerce Department reported Friday. That was above the 2.7%
estimate from the Dow Jones consensus.” Story at...
https://www.cnbc.com/2024/04/26/pce-inflation-march-2024-key-fed-inflation-measure-rose-2point8percent.html
My cmt: Yesterday’s number that I reported here from
Yahoo Finance was the “advance” Core PCE.
MARKET REPORT / ANALYSIS
-Friday the S&P 500 improved about 1% to 5100.
-VIX declined about 2% to 15.03.
-The yield on the 10-year Treasury declined to 4.663%.
MY TRADING POSITIONS:
QLD- Sold 4/8/2024
UWM – Sold 4/8/2024.
INTC – Sold 4/8/2024.
XLE – Added 4/24/2024
XLK – Technology ETF (holding since the October 2022
lows). I don’t want to pay taxes on this gain, so I am holding this position.
CRM – Added 1/22/2024
DWCPF - Dow Jones U.S. Completion Total Stock Market
Index. – Added 12/7/2023 when I sold the S&P 500.
“The Dow Jones U.S. Completion Total Stock Market Index,
also known as the DWCPF, is a widely used financial index that provides a
comprehensive measure of the US equity market. The DWCPF includes all US stocks
that are not included in the Dow Jones US Total Stock Market Index, which
comprises large-cap and mid-cap companies. As a result, the DWCPF provides a
complete picture of the US stock market, including small-cap and micro-cap
companies, which are often overlooked by other indexes.” From...
https://fi.money/blog/posts/what-is-dow-jones-u-s-completion-total-stock-market-index-dwcpf
CURRENT SUMMARY OF APPROXIMATELY 50 INDICATORS:
The Bull/Bear Spread (Bulls minus Bears) improved to
Neutral today. The Summary is now 10 Bear-signs and 10-Bull. (The rest are
neutral. It is normal to have a lot of neutral indicators since many of those
are top or bottom indicators that will signal only at extremes.) The chart
below also looks more bullish since the 10-dMA of the 50 Indicator Spread (Bulls
minus Bears) has been bottoming and again today, it turned up.
TODAY’S COMMENT:
The Fast Money crowd on CNBC was again talking about how
the advance has been narrow with only big names, Microsoft, Nvidia, Meta, etc.,
carrying the market. I don’t know about
that. Moving averages of the % of issues advancing on the NYSE for 10, 50 and
100-days are now all above 50%, i.e., more than half of the issues over those periods
have advanced. A lot of issues are participating. At the S&P 500 high at
the end of March, 13% of all issues on the NYSE made new, all-time highs – that
number suggests a broad advance and that if a decline were to occur, it would probably
be less than 10%. The max decline from the March high was 5.5%, five sessions
ago.
I’ve been saying for several days that I think the
pullback is over. Today, it looks like
the market is starting to agree with me.
LONG-TERM INDICATOR: The Long Term NTSM indicator
remained HOLD: VOLUME, VIX, PRICE & SENTIMENT are neutral.
(The Long-Term Indicator is not a good top-indicator. It
can signal BUY at a top.)
(The important major BUY in this indicator was on 21
October 2022, 7-days after the bear-market bottom. For my NTSM overall signal,
I suggested that a short-term buying opportunity occurred on 27 September
(based on improved market internals on the retest), although without market
follow-thru, I was unwilling to call a buy; however, I did close shorts and
increased stock holdings. I issued a Buy-Signal on 4 October, 6-days before the
final bottom, based on stronger market action that confirmed the market internals
signal. The NTSM sell-signal was issued 21 December, 9 sessions before the high
of this recent bear market, based on the bearish “Friday Rundown” of
indicators.)
BOTTOM LINE
I think this pullback is over and Monday I’ll place some
more bets in that direction by adding trading positions in SSO and QLD.
ETF - MOMENTUM ANALYSIS:
TODAY’S RANKING OF 15 ETFs (Ranked Daily) ETF ranking
follows:
The top ranked ETF receives
100%. The rest are then ranked based on their momentum relative to the leading
ETF.
*For additional background on
the ETF ranking system see NTSM Page at…
http://navigatethestockmarket.blogspot.com/p/exchange-traded-funds-etf-ranking.html
DOW STOCKS - TODAY’S MOMENTUM RANKING
OF THE DOW 30 STOCKS (Ranked Daily)
DOW 30 momentum ranking
follows:
The top ranked Stock receives
100%. The rest are then ranked based on their momentum relative to the leading Stock.
For more details, see NTSM
Page at…
https://navigatethestockmarket.blogspot.com/p/a-system-for-trading-dow-30-stocks-my_8.html
FRIDAY MARKET INTERNALS (NYSE
DATA)
My basket of Market Internals improved to BUY. (My basket of Market
Internals is a decent trend-following analysis of current market action, but
should not be used alone for short term trading. They are most useful when they
diverge from the Index.)
...My current invested
position is about 50% stocks, including stock mutual funds and ETFs. I’m
usually about 50% invested in stocks, so this is a fully-invested position.
I trade about 15-20% of the total portfolio using the
momentum-based analysis I provide here. When I see a definitive bottom, I add a
lot more stocks to the portfolio using an S&P 500 ETF as I did back in
October.
“Trade what you see; not what you think.” – The Old Fool,
Richard McCranie, trader extraordinaire.
“Far
more money has been lost by investors in preparing for corrections, or
anticipating corrections, than has been lost in the corrections themselves.” -
Peter Lynch, former manager of Fidelity’s Magellan® fund.
HYPOCRISY IN WASHINGTON (NY Post via msn.com)
“Hypocrisy is Washington, DC’s lifeblood, so it was a
nice change when DC Judge Ana Reyes [Biden appointed Judge] lambasted the
Justice Department for instructing two lawyers in its Tax Division to disregard
a congressional subpoena in the Hunter Biden investigation, all while it has
been zealously prosecuting Trump officials for the very same offense...
“There’s a person in jail right now because you all brought a criminal lawsuit
against him because he did not appear for a House subpoena,” Reyes said, referring
to Navarro [a former Trump trade adviser]. “And now you guys are flouting those
subpoenas... I think it’s quite rich you guys pursue criminal investigations
and put people in jail for not showing up.” Story at...
DC
judge points out pervasive hypocrisy hell that’s permeating every corner of the
federal government (msn.com)
My cmt: Hypocrisy in Washington? That could never happen.
“You will never find a more wretched hive of scum and
villainy.” – Obi-Wan visits Washington DC.
BIGGEST ENERGY BLUNDER EVER (State of the Union via
msn.com)
“Energy experts have raised concerns about electric
vehicles becoming widely adopted in the U.S. due to issues like cost and
affordability, range limitations, lack of charging infrastructure, reliability
questions, and impacts to the electric grid and energy costs. While government
policies heavily subsidize EVs, critics argue this amounts to a regressive
wealth transfer, with lower/middle income Americans shouldering the higher
costs...
...’We calculated that if you add on the socialized
infrastructure costs, and then in particular add on California’s zero emission
vehicle mandate, which adds cost to all of us because the automakers have to
pay to produce more EVs in California, and they spread that cost to the whole
country, the federal fuel economy regulations alone are subsidizing each EV by
about $20,000. Add all this together, and each EV is getting almost $50,000 in
subsidies.’” Story at...
EV
expert warns about ‘one of the biggest energy policy blunders we’ve ever made’
(msn.com)
"Think of how stupid the average person is, and
realize half of them are stupider than that."- George Carlin
“The Environmental Protection Agency’s own climate model
predicts that the proposed emissions standards for light, medium and heavy
vehicles would reduce global temperatures in 2100 by 0.02-degrees Celsius.” - Benjamin Zycher, American Enterprise Institute. From WSJ at...
https://www.wsj.com/articles/electric-vehicles-ev-wont-save-the-climate-carbon-eda2089e
My cmt: Isn’t that weird? Auto emissions contribute a
negligible amount to Climate change, but the Biden administration wants to
outlaw ICE (Internal Combustion Engines) by 2035. It reminds me that Democrats
canceled the Keystone Pipeline. As a result, oil must be carried by train to US
refineries, a more costly and environmentally risky proposition – but it
“sounds” better and plays to the environmental extremists.
“I suspect the initial rally may pause in here and some
pruning could be in the cards. While it’s not my preferred scenario, I guess
it’s possible that stocks bottomed already, but I still think the absolute low
lies ahead next month, even if it’s just at marginally lower levels.” – Paul
Schatz, President Heritagae Capital.
GDP / CORE PCE (Yahoo Finance)
“The US economy grew at its slowest pace in nearly two
years last quarter as inflation topped Wall Street estimates. The Bureau of
Economic Analysis's advance estimate of first quarter US gross domestic product
(GDP) showed the economy grew at an annualized pace of
1.6%...Meanwhile, the ‘core’ Personal Consumption Expenditures index, which
excludes the volatile food and energy categories, grew by 3.7% in the first
quarter, above estimates for 3.4%, and significantly higher than 2% gain seen
in the prior quarter... "The deceleration in GDP growth will not worry the
Fed as the details are better than the headline would suggest," Oxford
economics chief US economist Ryan Sweet said.” Story at...
https://finance.yahoo.com/news/gdp-us-economy-grows-at-16-annual-pace-in-first-quarter-falling-short-of-estimates-while-inflation-increases-123328820.html
My cmt: Markets are worried about inflation.
JOBLESS CLAIMS (Yahoo Finance)
“The Labor Department reported Thursday that unemployment
claims for the week ending April 20 fell by 5,000 to 207,000 from 212,000 the
previous week. That's the fewest since mid-February.” Story at...
https://finance.yahoo.com/news/us-applications-jobless-claims-fall-124135611.html
MARKET REPORT / ANALYSIS
-Thursday the S&P 500 declined about 0.5% to 5048.
-VIX declined about 4% to 15.37. (The Options Players aren’t
worried.)
-The yield on the 10-year Treasury rose to 4.704%.
MY TRADING POSITIONS:
QLD- Sold 4/8/2024
UWM – Sold 4/8/2024.
INTC – Sold 4/8/2024.
XLE – Added 4/24/2024
XLK – Technology ETF (holding since the October 2022
lows). I don’t want to pay taxes on this gain, so I am holding this position.
CRM – Added 1/22/2024
DWCPF - Dow Jones U.S. Completion Total Stock Market
Index. – Added 12/7/2023 when I sold the S&P 500. This is a large position
in my tax-deferred, retirement account betting on Smaller Caps. (This position
captures smaller cap and micro-cap stocks that are not included in the Dow
Jones US Total Stock Market Index. It is not a true small cap index. It is more like everything except the S&P
500.)
CURRENT SUMMARY OF APPROXIMATELY 50 INDICATORS:
The Bull/Bear Spread (Bulls minus Bears) had been
improving. Today, the 50-indicator spread moved more to the Bear side. The
Summary is currently 15 Bear-signs and 6-Bull. (The rest are neutral. It is
normal to have a lot of neutral indicators since many of those are top or
bottom indicators that will signal only at extremes.)
TODAY’S COMMENT:
The chart is bullish since it was up all day. Let’s see if the Index can follow thru on
Friday. I said yesterday, “my guess is that the pullback is over” based on indicators.
Given today’s reversal in indicators it looks like I was too early? Maybe, but I’ll
declare victory if the S&P 500 doesn’t make a new low. Today’s close was
about 1% above the recent low this past Friday. The Index could drop and retest
that low of 4967, but that is not something I can predict. It still looks like the
pullback is over. A big, one-day pullback of greater than 1% might be the flush
out signal we need to feel more confident. The bad PCE number could allow the serpents to creep into the porridge.
LONG-TERM INDICATOR: The Long Term NTSM indicator
remained HOLD: VOLUME is bearish; VIX, PRICE & SENTIMENT are neutral.
(The Long-Term Indicator is not a good top-indicator. It
can signal BUY at a top.)
(The important major BUY in this indicator was on 21
October 2022, 7-days after the bear-market bottom. For my NTSM overall signal,
I suggested that a short-term buying opportunity occurred on 27 September
(based on improved market internals on the retest), although without market
follow-thru, I was unwilling to call a buy; however, I did close shorts and
increased stock holdings. I issued a Buy-Signal on 4 October, 6-days before the
final bottom, based on stronger market action that confirmed the market internals
signal. The NTSM sell-signal was issued 21 December, 9 sessions before the high
of this recent bear market, based on the bearish “Friday Rundown” of
indicators.)
BOTTOM LINE
It still seems like this pullback is over or at least
winding down.
ETF - MOMENTUM ANALYSIS:
TODAY’S RANKING OF 15 ETFs (Ranked Daily) ETF ranking
follows:
The top ranked ETF receives
100%. The rest are then ranked based on their momentum relative to the leading
ETF.
*For additional background on
the ETF ranking system see NTSM Page at…
http://navigatethestockmarket.blogspot.com/p/exchange-traded-funds-etf-ranking.html
DOW STOCKS - TODAY’S MOMENTUM RANKING
OF THE DOW 30 STOCKS (Ranked Daily)
DOW 30 momentum ranking
follows:
The top ranked Stock receives
100%. The rest are then ranked based on their momentum relative to the leading Stock.
For more details, see NTSM
Page at…
https://navigatethestockmarket.blogspot.com/p/a-system-for-trading-dow-30-stocks-my_8.html
THURSDAY MARKET INTERNALS
(NYSE DATA)
My basket of Market Internals remained HOLD. (My basket of Market
Internals is a decent trend-following analysis of current market action, but
should not be used alone for short term trading. They are most useful when they
diverge from the Index.)
...My current invested
position is about 50% stocks, including stock mutual funds and ETFs. I’m
usually about 50% invested in stocks, so this is a fully-invested position.
I trade about 15-20% of the total portfolio using the
momentum-based analysis I provide here. When I see a definitive bottom, I add a
lot more stocks to the portfolio using an S&P 500 ETF as I did back in
October.
“Trade what you see; not what you think.” – The Old Fool,
Richard McCranie, trader extraordinaire.
“Far
more money has been lost by investors in preparing for corrections, or
anticipating corrections, than has been lost in the corrections themselves.” -
Peter Lynch, former manager of Fidelity’s Magellan® fund.
TRUMP’S IMMUNITY ARGUMENTS (AJC)
“The Supreme Court Thursday will hear arguments on
whether Donald Trump is immune from prosecution for actions he took while
president, and its decision could sink or delay some of the criminal cases
against him, including Georgia’s [election interference case] ... ‘This may,
indeed, be the most important Supreme Court case in the history of our
country,’ said Donald Ayer, a Georgetown University law professor and former
deputy attorney general under George H.W. Bush. ‘The rule of law is being
tested today as it never has been before...’ A U.S. District Court judge in
Washington had already
rejected Trump’s claim of “absolute immunity.” In February, the appeals
court upheld that decision. Now Trump will make his case to the
Supreme Court.” Story at...
https://www.ajc.com/politics/trumps-immunity-argument-could-scuttle-or-delay-georgia-case/ET75OU2TMNE7HIPUJGH3DTTUQQ/
DURABLE GOODS (fxstreet)
“Durable Goods Orders in the US rose
2.6%..."Excluding transportation, new orders increased 0.2%," the US
Census Bureau said in the press release.” From...
https://www.fxstreet.com/news/us-durable-goods-orders-rise-26-in-march-to-2834-billion-202404241235
CRUDE INVENTORIES (EIA)
“U.S. commercial crude oil inventories (excluding those
in the Strategic Petroleum Reserve) decreased by 6.4 million barrels from the
previous week. At 453.6 million barrels, U.S. crude oil inventories are about
3% below the five year average for this time of year.” Report at...
https://ir.eia.gov/wpsr/wpsrsummary.pdf
MARKET REPORT / ANALYSIS
-Wednesday the S&P 500 was little changed at 5072.
-VIX rose about 2% to 15.97.
-The yield on the 10-year Treasury rose to 4.646%.
MY TRADING POSITIONS:
QLD- Sold 4/8/2024
UWM – Sold 4/8/2024.
INTC – Sold 4/8/2024.
XLE – Added 4/24/2024
XLK – Technology ETF (holding since the October 2022
lows). I don’t want to pay taxes on this gain, so I am holding this position.
CRM – Added 1/22/2024
DWCPF - Dow Jones U.S. Completion Total Stock Market
Index. – Added 12/7/2023 when I sold the S&P 500. This is a large position
in my tax-deferred, retirement account betting on Smaller Caps. (This position
captures smaller cap and micro-cap stocks that are not included in the Dow
Jones US Total Stock Market Index. It is not a true small cap index. It is more like everything except the S&P
500.)
CURRENT SUMMARY OF APPROXIMATELY 50 INDICATORS:
Today, the 50-indicator spread (Bulls minus Bears)
remains more to the Bear side, but it improved again. The Summary is currently
12 Bear-signs and 8-Bull (the rest are neutral). It is normal to have a lot of
neutral indicators since many of those are top or bottom indicators that will
signal only at extremes.
TODAY’S COMMENT:
As usually happens, there are some cross-currents in the
indicators. Consumer Staples outpaced the S&P 500 by a lot today. Utilities
are outpacing the S&P 500 in momentum in my system and that’s a longer-term
analysis and that is a very bearish sign. Both suggest investors are buying
safety.
On the other hand, the 10-dMA of the spread of 50
Indicators (Bull minus Bear) finally turned up. As the chart shows, in recent
history, the 10-day spread (purple line) has turned up shortly after a bottom,
so the indicators are suggesting that markets have made a bottom. If it is a correct
signal this time, it is turning up 3 days after the bottom. Given the worrisome
flight to safety, the concern is that the signal may not be correct.
Despite those concerns, today, I added XLE (Energy Sector
ETF).
Based on the overall indicators, my guess is that the
pullback is over. As I write this, S&P
500 futures are down 0.6% and Nas futures are down more than 1%, so the options
players think that I am wrong. It wouldn’t be the first time.
LONG-TERM INDICATOR: The Long Term NTSM indicator
remained HOLD: VOLUME, VIX, PRICE & SENTIMENT are neutral.
(The Long-Term Indicator is not a good top-indicator. It
can signal BUY at a top.)
(The important major BUY in this indicator was on 21
October 2022, 7-days after the bear-market bottom. For my NTSM overall signal,
I suggested that a short-term buying opportunity occurred on 27 September
(based on improved market internals on the retest), although without market
follow-thru, I was unwilling to call a buy; however, I did close shorts and
increased stock holdings. I issued a Buy-Signal on 4 October, 6-days before the
final bottom, based on stronger market action that confirmed the market
internals signal. The NTSM sell-signal was issued 21 December, 9 sessions
before the high of this recent bear market, based on the bearish “Friday Rundown”
of indicators.)
BOTTOM LINE
It still seems like this pullback is over or at least
winding down.
ETF - MOMENTUM ANALYSIS:
TODAY’S RANKING OF 15 ETFs (Ranked Daily) ETF ranking
follows:
The top ranked ETF receives
100%. The rest are then ranked based on their momentum relative to the leading
ETF.
*For additional background on
the ETF ranking system see NTSM Page at…
http://navigatethestockmarket.blogspot.com/p/exchange-traded-funds-etf-ranking.html
DOW STOCKS - TODAY’S MOMENTUM RANKING
OF THE DOW 30 STOCKS (Ranked Daily)
DOW 30 momentum ranking
follows:
The top ranked Stock receives
100%. The rest are then ranked based on their momentum relative to the leading Stock.
For more details, see NTSM
Page at…
https://navigatethestockmarket.blogspot.com/p/a-system-for-trading-dow-30-stocks-my_8.html
WEDNESDAY MARKET INTERNALS
(NYSE DATA)
My basket of Market Internals remained HOLD. (My basket of Market
Internals is a decent trend-following analysis of current market action, but
should not be used alone for short term trading. They are most useful when they
diverge from the Index.)
...My current invested
position is about 50% stocks, including stock mutual funds and ETFs. I’m
usually about 50% invested in stocks, so this is a fully-invested position.
I trade about 15-20% of the total portfolio using the
momentum-based analysis I provide here. When I see a definitive bottom, I add a
lot more stocks to the portfolio using an S&P 500 ETF as I did back in
October.
“Trade what you see; not what you think.” – The Old Fool,
Richard McCranie, trader extraordinaire.
“Far
more money has been lost by investors in preparing for corrections, or
anticipating corrections, than has been lost in the corrections themselves.” -
Peter Lynch, former manager of Fidelity’s Magellan® fund.
NEW HOME SALES / PERMITS (CNN)
“New home sales, which make up about 10% of the market,
jumped 8.8% last month to a seasonally adjusted annual rate of 693,000... Meanwhile,
building permits for future construction tumbled 3.7% in March to a five-month
low.” Story at...
https://www.cnn.com/2024/04/23/economy/new-home-sales-march/index.html
MARKET REPORT / ANALYSIS
-Tuesday the S&P 500 rose about 1.2% to 5071.
-VIX fell about 7% to 16.94.
-The yield on the 10-year Treasury declined to 4.607%.
MY TRADING POSITIONS:
QLD- Sold 4/8/2024
UWM – Sold 4/8/2024.
INTC – Sold 4/8/2024.
XLK – Technology ETF (holding since the October 2022
lows). I don’t want to pay taxes on this gain, so I am holding this position.
CRM – Added 1/22/2024
DWCPF - Dow Jones U.S. Completion Total Stock Market
Index. – Added 12/7/2023 when I sold the S&P 500. This is a large position
in my tax-deferred, retirement account betting on Smaller Caps. (This position
captures smaller cap and micro-cap stocks that are not included in the Dow
Jones US Total Stock Market Index.)
CURRENT SUMMARY OF APPROXIMATELY 50 INDICATORS:
Today, the 50-indicator spread (Bulls minus Bears) remains
more to the Bear side, but Bear-signals decreased by 2 and Bull-signals
increased by 2. The Summary is currently 14 Bear-signs and 8-Bull (the rest
are neutral).
TODAY’S COMMENT:
The 10-dMA of indicator spread (Bull minus Bear) declined
again today so we are not getting a buy-signal there. The daily numbers may be giving a better
clue. The spread today was -6; it was
-13 just four trading days ago. 10-day averages tend to lag; the daily numbers
are suggesting “Buy” so aggressive investors may want to buy-the-dip now.
My Money Trend indicator can be a pretty good indicator
at turning point; it is bullish. We saw a couple of days when both Bollinger
Bands and RSI were oversold. We also note that 80% of volume was up-volume
today. That’s good, but by itself this is not an actionable signal. If we see another 80% up-volume day Wednesday,
I would consider it a bullish sign worthy of buying.
All in all, I suspect the pullback has made a bottom and
I’ll probably add a stock trading-position tomorrow, but small retreats (less
than 10%) give small signals. If we see the 10-dMA of the 50 Indicator Spread
turn higher then I think this pullback will be over.
LONG-TERM INDICATOR: The Long Term NTSM indicator remained
HOLD: VIX, PRICE & SENTIMENT are neutral; VOLUME is bearish.
(The Long-Term Indicator is not a good top-indicator. It
can signal BUY at a top.)
(The important major BUY in this indicator was on 21
October 2022, 7-days after the bear-market bottom. For my NTSM overall signal,
I suggested that a short-term buying opportunity occurred on 27 September
(based on improved market internals on the retest), although without market
follow-thru, I was unwilling to call a buy; however, I did close shorts and
increased stock holdings. I issued a Buy-Signal on 4 October, 6-days before the
final bottom, based on stronger market action that confirmed the market internals
signal. The NTSM sell-signal was issued 21 December, 9 sessions before the high
of this recent bear market, based on the bearish “Friday Rundown” of
indicators.)
BOTTOM LINE
It still seems like this pullback is winding down and I plan to add a trading position tomorrow (most likely one of the higher momentum ETFs). I'll add more when I see the indicators improve.
ETF - MOMENTUM ANALYSIS:
TODAY’S RANKING OF 15 ETFs (Ranked Daily) ETF ranking
follows:
The top ranked ETF receives
100%. The rest are then ranked based on their momentum relative to the leading
ETF.
*For additional background on
the ETF ranking system see NTSM Page at…
http://navigatethestockmarket.blogspot.com/p/exchange-traded-funds-etf-ranking.html
DOW STOCKS - TODAY’S MOMENTUM RANKING
OF THE DOW 30 STOCKS (Ranked Daily)
DOW 30 momentum ranking
follows:
The top ranked Stock receives
100%. The rest are then ranked based on their momentum relative to the leading Stock.
For more details, see NTSM
Page at…
https://navigatethestockmarket.blogspot.com/p/a-system-for-trading-dow-30-stocks-my_8.html
TUESDAY MARKET INTERNALS (NYSE
DATA)
My basket of Market Internals remained HOLD. (My basket of Market
Internals is a decent trend-following analysis of current market action, but
should not be used alone for short term trading. They are most useful when they
diverge from the Index.)
...My current invested
position is about 50% stocks, including stock mutual funds and ETFs. I’m
usually about 50% invested in stocks, so this is a fully-invested position.
I trade about 15-20% of the total portfolio using the
momentum-based analysis I provide here. When I see a definitive bottom, I add a
lot more stocks to the portfolio using an S&P 500 ETF as I did back in
October.