“Trade what you see; not what you think.” – The Old Fool,
Richard McCranie, trader extraordinaire.
“For decades we disagreed with [Supreme] Court rulings
when progressives held sway, but we never called the Court illegitimate. But
now that the left has lost the Court as a backup legislature for its policy
goals, the institution is supposedly broken. Tell us again who is the threat to
democratic institutions?” – WSJ Editorial Board.
CHICAGO PMI (Advisor Perspectives)
“The latest Chicago Purchasing Manager's Index, or the
Chicago Business Barometer, dropped to 45.2 in September from 45.7 in
September, which is in contraction territory.” Story at...
https://www.advisorperspectives.com/dshort/updates/2022/10/31/chicago-pmi-dipped-in-october
MARKET BULDS ON THE BOTTOM AND NO RECESSION (Heritage
capital)
“Over and over and over, I have discussed the idea that
the October 13th low was either a low of significance or the final bottom in
the bear market...I have been firmly in the camp that the U.S. will not be in
recession in 2022. Even after back to back negative GDP quarters I said the
same thing. The employment market is way too strong.” - Paul Schatz. Commentary
at...
https://investfortomorrow.com/blog/market-build-on-the-bottom-still-no-recession/
PELOSI ATTACKER A PSYCHOTIC HOMELESS ADICT (Michael
Shellenberger)
“Neighbors described DePape as a homeless addict with a
politics that was, until recently, left-wing, but of secondary importance to
his psychotic and paranoid behavior. “What I know about the family is that
they’re very radical activists,” said one of DePape’s neighbors, a woman who
only gave her first name, Trish. “They seem very left. They are all about the
Black Lives Matter movement. Gay pride. But they’re very detached from reality.
They have called the cops on several of the neighbors, including us, claiming
that we are plotting against them. It’s really weird to see that they are
willing to be so aggressive toward somebody else who is also a
lefty.”...Wrapped up in their own obsession with Trump Republicans, most
journalists have missed the real story. David DePape is not a microcosm of the
political psychosis gripping America in general. Rather, he’s a microcosm of
the drug-induced psychosis gripping the West Coast in particular.” Story at...
https://michaelshellenberger.substack.com/p/pelosi-attack-suspect-was-a-psychotic
MARKET REPORT / ANALYSIS
-Monday the S&P 500 dropped about 0.8% to 3872.
-VIX rose about 0.5% to 25.88. (That’s a small increase
for a 0.8% drop in the S&P 500.)
-The yield on the 10-year Treasury was 4.048%.
PULLBACK DATA:
-Drop from Top: 19.3% as of today. 25.4% max (on a
closing basis).
-Trading Days since Top: 208-days.
The S&P 500 is 5.8% Below its 200-dMA & 1% ABOVE
its 50-dMA.
*I won’t call the correction over until the S&P 500
makes a new-high; however, evidence suggests the bottom was / is in the 3600
area and I am fully invested with a higher percentage of stocks than normal.
MY TRADING POSITIONS:
XLI – Industrial ETF
QLD – 2x Nas 100
DDM – 2x Dow 30
XLK – Technology ETF
CVX – (I may hold this as a long-term position. I already
owned a small position in CVX.)
TODAY’S COMMENT:
So as noted previously, I got a Buy-signal Tuesday,
27 September. That was confirmed 28 September with a big up-Day, but
followed by very weak days 29 and 30 September. That rattled my
confidence that the buy-signal was valid. Monday and Tuesday, 3 and 4
October, we saw high up-volume days, so I concluded the buy-signal was valid. We
did see the markets drop 2% below my Buy-signal, but it has been all up since
the 12 October low.
Now, even some of the CNBC Fast Money crew are talking
about a “bottoming process” instead of doom and gloom.
Markets are likely to be on edge this week due to the Fed
meeting this week. The announcement will be made Wednesday. A 75 basis point
(3/4%) increase is baked into the cake, but investors are hoping for some
dovish language in the announcement.
Today, the daily sum of 20 Indicators declined from +15
to +13 (a positive number is bullish; negatives are bearish); the 10-day
smoothed sum that smooths the daily fluctuations improved from +107 to +111.
(The trend direction is more important than the actual number for the 10-day
value.) These numbers sometimes change after I post the blog based on data that
comes in late. Most of these 20 indicators are short-term so they tend to
bounce around a lot.
LONG-TERM INDICATOR: The Long
Term NTSM indicator remained BUY: SENTIMENT & VIX are neutral; PRICE &
VOLUME are bullish.
Bottom line: I’m a Bull: I’m now invested with about 75%
of the portfolio invested in stocks. (As a retiree, 50% invested in stocks is
my “normal” portfolio.) 75% stocks is uber-bullish and that’s as far as I’ll
go.
BEST ETFs - MOMENTUM ANALYSIS:
TODAY’S RANKING OF 15 ETFs
(Ranked Daily)
ETF ranking follows:
The top ranked ETF receives
100%. The rest are then ranked based on their momentum relative to the leading
ETF.
#1. XLE #2. ITA #2. IBB (#2 Tied)
3. XLF
*For additional background on
the ETF ranking system see NTSM Page at…
http://navigatethestockmarket.blogspot.com/p/exchange-traded-funds-etf-ranking.html
BEST DOW STOCKS - TODAY’S MOMENTUM
RANKING OF THE DOW 30 STOCKS (Ranked Daily)
DOW 30 momentum ranking
follows:
#1.CAT #2.CVX #3. AMGN
The top ranked Stock receives
100%. The rest are then ranked based on their momentum relative to the leading Stock.
For more details, see NTSM
Page at…
https://navigatethestockmarket.blogspot.com/p/a-system-for-trading-dow-30-stocks-my_8.html
MONDAY MARKET INTERNALS (NYSE
DATA)
My basket of Market Internals slipped to HOLD.
(Market Internals are a decent trend-following
analysis of current market action, but should not be used alone for short term
trading. They are most useful when they diverge from the Index.)
...My current invested
position is about 75% stocks, including stock mutual funds and ETFs. I’m
usually about 50% invested in stocks. I’ll cut back on stocks if we see serious
bear signs.
I trade about 15-20% of the
total portfolio using the momentum-based analysis I provide here. If I can see
a definitive bottom, I’ll add a lot more stocks to the portfolio using an
S&P 500 ETF.
“Trade what you see; not what you think.” – The Old Fool,
Richard McCranie, trader extraordinaire.
“For decades we disagreed with [Supreme] Court rulings
when progressives held sway, but we never called the Court illegitimate. But
now that the left has lost the Court as a backup legislature for its policy
goals, the institution is supposedly broken. Tell us again who is the threat to
democratic institutions?” – WSJ Editorial Board.
PCE PRICES / PERSONAL SPENDING / PERSONAL INCOME /
EMPLOYMENT COST INDEX (CNBC)
“The core personal consumption expenditures price index
increased 0.5% from the previous month and accelerated 5.1% over the past 12
months... Including food and energy, PCE inflation rose 0.3% for the month and
6.2% on a yearly basis, the same as in August...
...personal income increased 0.4% in September, one-tenth
of a percentage point above the estimate. Spending as gauged through personal
consumption expenditures increased 0.6%, more than the 0.4% estimate...
...employment costs rose 1.2% for the third quarter, in
line with estimates, according to the Bureau of Labor Statistics. On an annual
basis, the employment cost index increased 5%, slightly lower than the 5.1%
pace in the second quarter.” Story at...
https://www.cnbc.com/2022/10/28/pce-inflation-september-2022-.html
THE ADMINISTRATION SAID TODAY THAT COVID IS INCREASING
(NTSM)
Is it? Most of the variation in the daily numbers are
caused by how the data is reported. Smoothed data tells the real story. Data from Johns Hopkins at...
https://coronavirus.jhu.edu/map.html
MARKET REPORT / ANALYSIS
-Friday the S&P 500 rose about 2.5% to 3901.
-VIX dropped about 6% to 25.75.
-The yield on the 10-year Treasury rose to 4.016%.
PULLBACK DATA:
-Drop from Top: 18.7% as of today. 25.4% max (on a
closing basis).
-Trading Days since Top: 207-days.
The S&P 500 is 5.2% Below its 200-dMA & 1.5% ABOVE
its 50-dMA.
*I won’t call the correction over until the S&P 500
makes a new-high; however, evidence suggests the bottom was / is in the 3600
area and I am fully invested with a higher percentage of stocks than normal.
MY TRADING POSITIONS:
XLI – Industrial ETF
QLD – 2x Nas 100
DDM – 2x Dow 30
XLK – Technology ETF
CVX – (I may hold this as a long-term position. I already
owned a small position in CVX.)
TODAY’S COMMENT:
When the S&P 500 failed to make it above its 50-dMA a
few days ago, I suggested it didn’t mean much and I thought the rally would
continue. Today, that was proved true as
the Index broke 1.5% above its 50-dMA. That will be a bullish sign assuming, the
index stays above the 50-day on successive days; I expect it will. The Index
closed slightly below its 100-dMA; I expect it to break above that level, too.
Friday unchanged volume was high. As I’ve often said,
many believe that this indicator suggests investor confusion at market turning
points. My problem is that it is frequently a false signal. This indicator has
been correct a couple times when we’ve seen it recently, but not the most
recent ones on 18 & 21 October. Mr. Market ignored those signals. Now, I’ll
ignore it due to other more compelling bullish signs.
On Fridays, I summarize a number of indicators to get a
weekly feel for trend. The Friday rundown of indicators improved and is now extremely
bullish (4-bear and 23-bull). These indicators tend to be both long-term and
short-term, so they are different than the 20 that I report on daily.
BULL SIGNS
-The
10-dMA percentage of issues advancing on the NYSE (Breadth) is above 50%.
-MACD of S&P 500 price made a bullish crossover 13
Oct.
-The 52-week, New-high/new-low ratio improved by 3.5
standard deviations. More simply, the spread between new-highs and new-lows
improved by 716 on 14 October. That’s another solid bottom sign at a retest.
-Issues advancing on the NYSE (Breadth) compared to the
S&P 500 are bullish. (Breadth is ahead of the Index.)
-The longer-term, 50-dEMA, Fosback Hi-Low Logic Index is
Bullish.
-On average, the size of up-moves has been larger than
the size of down-moves over the last month.
-21 Oct was a Bullish Outside Reversal Day.
-Cyclical Industrials (XLI-ETF) are outpacing the S&P
500.
-17 and 18 Oct were back-to-back 80%+ up-volume days.
-S&P 500 is outperforming the Utilities (XLU).
-The smoothed advancing volume on the NYSE is rising.
-Smoothed Buying Pressure minus Selling Pressure is rising.
(While it’s falling, there is a strong bullish divergence when today’s values are
compared to the June lows.)
-McClellan Oscillator.
-The Smart Money (late-day action) suggests Pros are
buying.
-There
was a Follow-Thru Day 21 October that cancels prior Distribution Days.
-My Money Trend indicator turned up.
-Short-term new-high/new-low data.
-Long-term new-high/new-low data.
-Sentiment.
- 72% of the 15-ETFs that I track have been up over the
last 10-days.
-Slope of the 40-dMA of New-highs is rising.
-The 5-10-20 Timer System is BUY; the 5-dEMA and 10-dEMA
are both above the 20-dEMA. (The 5-day is above the 10-day so short-term
momentum is bullish too.)
-MACD of the percentage of issues advancing on the NYSE
(breadth) made a bullish crossover 26 Oct.
NEUTRAL
-There have been 9 up-days over the last 20 sessions.
-There have been 6 up-days over the last 10 sessions –
neutral.
-There have been 4 Statistically-Significant days (big
moves in price-volume) in the last 15-days.
-The S&P 500 is 5.2% below its 200-dMA. (Bull
indicator is 12% below the 200-day, although this is based on “normal”
pullbacks.)
-Bollinger Bands.
-RSI
-The short-term, 10-day, Fosback Hi-Low Logic Index.
-The Calm-before-the-Storm/Panic Indicator warned on 13
September - expired.
-There was an Inverse Zweig Breadth Collapse (negative
Breadth Thrust) 21 June. That’s a rare, very-bearish sign, but it was
several-weeks ago - expired.
-There was a Hindenburg Omen signal 8 April – expired.
-2.8% of all issues traded on the NYSE made new, 52-week highs
when the S&P 500 made a new all-time-high, 3 January. (There is no bullish
signal for this indicator.) This indicated that the advance was too narrow and
a correction was likely to be >10%. – It proved correct, but is now Expired
-VIX indicator.
-The graph of the 100-day Count (the 100-day sum of
up-days) is flat.
BEAR SIGNS
-Overbought/Oversold Index (Advance/Decline Ratio).
-The 50-dMA percentage of issues advancing on the NYSE
(Breadth) is below 50.
-The
100-dMA percentage of issues advancing on the NYSE (Breadth) is below 50%
-The 50-dMA percentage of issues advancing on the NYSE
(Breadth) has been below 50%, for 3 days in a row below 50% for my
“correction-now” signal. – It hardly matters now.
On Friday, 21 February, 2 days after the top before the
Coronavirus pullback, there were 10 bear-signs and 1 bull-sign. Now there
are 4 bear-signs and 23-Bull. Last week, there were 10 bear-signs and 18
bull-signs. Friday indicators are leaning slightly to the bull side.
Today, the daily sum of 20 Indicators remained +15 (a
positive number is bullish; negatives are bearish); the 10-day smoothed sum
that smooths the daily fluctuations improved from +101 to +107. (The trend
direction is more important than the actual number for the 10-day value.) These
numbers sometimes change after I post the blog based on data that comes in
late. Most of these 20 indicators are short-term so they tend to bounce
around a lot.
LONG-TERM INDICATOR: The Long
Term NTSM indicator remained BUY: VIX is neutral; SENTIMENT, PRICE & VOLUME
are bullish.
Bottom line: I’m a Bull: I’m now invested with about 75%
of the portfolio invested in stocks. (As a retiree, 50% invested in stocks is
my “normal” portfolio.) 75% stocks is uber-bullish and that’s as far as I’ll
go.
BEST ETFs - MOMENTUM ANALYSIS:
TODAY’S RANKING OF 15 ETFs
(Ranked Daily)
ETF ranking follows:
The top ranked ETF receives
100%. The rest are then ranked based on their momentum relative to the leading
ETF.
#1. XLE #2. ITA #2. IBB
*For additional background on
the ETF ranking system see NTSM Page at…
http://navigatethestockmarket.blogspot.com/p/exchange-traded-funds-etf-ranking.html
BEST DOW STOCKS - TODAY’S MOMENTUM
RANKING OF THE DOW 30 STOCKS (Ranked Daily)
DOW 30 momentum ranking
follows:
#1.CVX #2.CAT #3. AMGN
The top ranked Stock receives
100%. The rest are then ranked based on their momentum relative to the leading Stock.
For more details, see NTSM
Page at…
https://navigatethestockmarket.blogspot.com/p/a-system-for-trading-dow-30-stocks-my_8.html
FRIDAY MARKET INTERNALS (NYSE
DATA)
My basket of Market Internals remained BUY.
(Market Internals are a decent trend-following
analysis of current market action, but should not be used alone for short term
trading. They are most useful when they diverge from the Index.)
...My current invested
position is about 75% stocks, including stock mutual funds and ETFs. I’m
usually about 50% invested in stocks. I’ll cut back on stocks if we see serious
bear signs.
I trade about 15-20% of the
total portfolio using the momentum-based analysis I provide here. If I can see
a definitive bottom, I’ll add a lot more stocks to the portfolio using an
S&P 500 ETF.
“Trade what you see; not what you think.” – The Old Fool,
Richard McCranie, trader extraordinaire.
“For decades we disagreed with [Supreme] Court rulings
when progressives held sway, but we never called the Court illegitimate. But
now that the left has lost the Court as a backup legislature for its policy
goals, the institution is supposedly broken. Tell us again who is the threat to
democratic institutions?” – WSJ Editorial Board.
Political commentary at...
https://michaelpramirez.com/index.html
GDP (CNBC)
“The U.S. economy posted its first period of positive
growth for 2022 in the third quarter, at least temporarily easing recession
fears, the Bureau of Economic Analysis reported Thursday.
GDP, a sum of all the goods and services produced from
July through September, increased at a 2.6% annualized pace for the period...
https://www.cnbc.com/2022/10/27/us-gdp-accelerated-at-2point6percent-pace-in-q3-better-than-expected-as-growth-turns-positive.html
Just a reminder...
“Gross Domestic Product (GDP). GDP is
simply the total amount of spending in an economy. GDP, as currently measured,
does not distinguish between “good” spending and “bad” spending. GDP does not
distinguish between consumption spending and investment spending. GDP also does
not distinguish whether spending is generated by existing wealth, by going into
debt temporarily, or by going into debt permanently. In this world, every dollar
spent on education or new means of production, is counted the same as every
dollar spent on epic bachelor parties and video games.” – Michael Lebowitz,
Real Investment Advice
JOBLESS CLAIMS (Yahoo Finance)
“The number of Americans filing for unemployment
insurance grew by less than expected last week, according to data from the
Labor Department. Seasonally adjusted initial jobless claims during the period totaled 217,000,
up from the unrevised prior level of 214,000.” Story at...
https://finance.yahoo.com/news/weekly-jobless-claims-rise-217-094610080.html
DURABLE ORDERS (MarketWatch)
“New orders for durable goods-products meant to last at
least three years-rose by 0.4% in September to a seasonally adjusted $274.7
billion, the Commerce Department said Thursday.” Story at...
https://www.marketwatch.com/story/jump-in-aircraft-orders-drive-increase-in-durable-goods-demand-271666874923?mod=newsviewer_click
MARKET REPORT / ANALYSIS
-Thursday the S&P 500 dropped about 0.6% to 3807.
-VIX rose about 0.4% to 27.39.
-The yield on the 10-year Treasury slipped to 3.935%.
PULLBACK DATA:
-Drop from Top: 20.6% as of today. 25.4% max (on a
closing basis).
-Trading Days since Top: 206-days.
The S&P 500 is 7.5% Below its 200-dMA & 1.1%
Below its 50-dMA.
*I won’t call the correction over until the S&P 500
makes a new-high; however, evidence suggests the bottom was / is in the 3600
area and I am fully invested with a higher percentage of stocks than normal.
MY TRADING POSITIONS:
XLI – Industrial ETF
QLD – 2x Nas 100
DDM – 2x Dow 30
XLK – Technology ETF
CVX – (I may hold this as a long-term position. I already
owned a small position in CVX.)
TODAY’S COMMENT:
Junk Bonds (JNK-ETF) continue to march higher; advancers
outpaced decliners; up-volume was higher than down-volume; new-highs and
new-lows are improving; “What’s not to like?” Ans: Forward guidance. Companies
are giving weak guidance during their earnings calls causing doubt for future
earnings. For example, “Amazon shares
plummeted 13% in extended trading on Thursday after the company issued a
disappointing fourth-quarter forecast and missed on revenue estimates.” Story at...
https://www.cnbc.com/2022/10/27/amazon-amzn-earnings-q3-2022.html
Today was an odd day. When I see advancing issues beating
declining issues and the S&P 500 is down, I conclude that small caps were
out-performing large caps. That was the case today, but the DJI (Dow30) was up on
the day. It is unusual to see the Dow up and the S&P 500 down. I don’t know
that we can infer any market moves from today’s action. Still, when most issues
are going up (advancers outpace decliners) the S&P 500 usually catches
up. It may be the high flyers in the Nasdaq
are the last group of stocks to be taken to the woodshed in this downturn. I still think the bottom is in. We’ll see...
Today, the daily sum of 20 Indicators slipped from +16 to
+15 (a positive number is bullish; negatives are bearish); the 10-day smoothed
sum that smooths the daily fluctuations improved from +92 to +101. (The trend
direction is more important than the actual number for the 10-day value.) These
numbers sometimes change after I post the blog based on data that comes in late.
Most of these 20 indicators are short-term so they tend to bounce around a
lot.
LONG-TERM INDICATOR: The Long
Term NTSM indicator remained BUY: VIX is neutral; SENTIMENT, PRICE & VOLUME
are bullish.
Bottom line: I’m a Bull: I’m now invested with about 75%
of the portfolio invested in stocks. (As a retiree, 50% invested in stocks is
my “normal” portfolio.) 75% stocks is uber-bullish and that’s as far as I’ll
go.
BEST ETFs - MOMENTUM ANALYSIS:
TODAY’S RANKING OF 15 ETFs
(Ranked Daily)
ETF ranking follows:
The top ranked ETF receives
100%. The rest are then ranked based on their momentum relative to the leading
ETF.
#1. XLE #2. IBB #2. ITA
*For additional background on
the ETF ranking system see NTSM Page at…
http://navigatethestockmarket.blogspot.com/p/exchange-traded-funds-etf-ranking.html
BEST DOW STOCKS - TODAY’S MOMENTUM
RANKING OF THE DOW 30 STOCKS (Ranked Daily)
DOW 30 momentum ranking
follows:
#1.CVX #2.AMGN #3.MRK
The top ranked Stock receives
100%. The rest are then ranked based on their momentum relative to the leading Stock.
For more details, see NTSM
Page at…
https://navigatethestockmarket.blogspot.com/p/a-system-for-trading-dow-30-stocks-my_8.html
THURSDAY MARKETY INTERNALS
(NYSE DATA)
My basket of Market Internals remained BUY.
(Market Internals are a decent trend-following
analysis of current market action, but should not be used alone for short term
trading. They are most useful when they diverge from the Index.)
...My current invested
position is about 75% stocks, including stock mutual funds and ETFs. I’m
usually about 50% invested in stocks. I’ll cut back on stocks if we see serious
bear signs.
I trade about 15-20% of the
total portfolio using the momentum-based analysis I provide here. If I can see
a definitive bottom, I’ll add a lot more stocks to the portfolio using an
S&P 500 ETF.
“Trade what you see; not what you think.” – The Old Fool,
Richard McCranie, trader extraordinaire.
“For decades we disagreed with [Supreme] Court rulings
when progressives held sway, but we never called the Court illegitimate. But
now that the left has lost the Court as a backup legislature for its policy
goals, the institution is supposedly broken. Tell us again who is the threat to
democratic institutions?” – WSJ Editorial Board.
NEW HOME SALES (YahooFinance)
“The volume of sales came in at a seasonally adjusted
annual rate of 603,000, down 10.9% from the previous month’s revised pace of
677,000 and 17.6% below year ago levels...” Story at...
https://money.yahoo.com/new-home-sales-140626719.html
EIA CRUDE INVENTORIES (EIA)
“U.S. commercial crude oil inventories (excluding those
in the Strategic Petroleum Reserve) increased by 2.6 million barrels from the
previous week. At 439.9 million barrels, U.S. crude oil inventories are about
2% below the five year average for this time of year.” Report at...
https://ir.eia.gov/wpsr/wpsrsummary.pdf
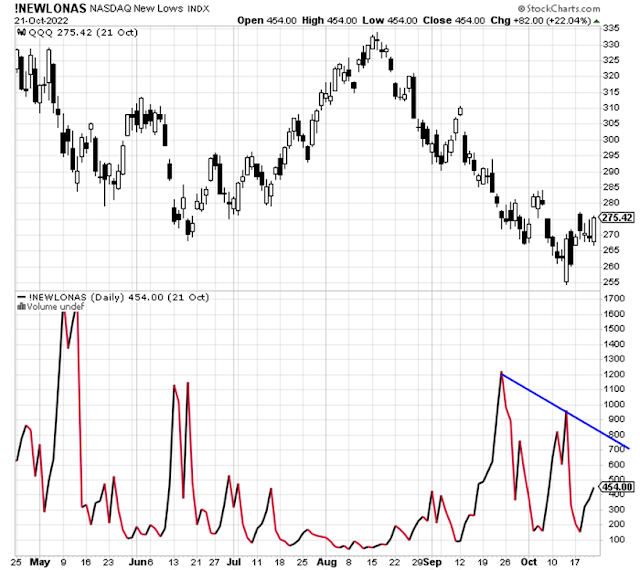
CONFOUNDING THE MASSES - COMMENTARY EXCERPT (Heritage
Capital)
“Let’s turn to the NASDAQ and the number of stocks making
new 52 week lows. On the right side of the chart I drew a blue line to show
that each successive lower low in price has been accompanied by less stocks
making new lows. That indicates a loss of downside momentum and a positive
divergence or non-confirmation. This kind of behavior is almost always seen at
market bottoms.
Remember, the markets will bottom (and they may have
already) long before the Fed stops raising rates and even pivots.” – Paul
Schatz, President heritage Capital. Commentary at...
https://investfortomorrow.com/blog/confounding-the-masses/
MARKET REPORT / ANALYSIS
-Wednesday the S&P 500 dropped about 0.7% to 3831.
-VIX bucked the trend and dipped about 4% to 27.28.
-The yield on the 10-year Treasury slipped to 4.007%.
PULLBACK DATA:
-Drop from Top: 20.1% as of today. 25.4% max (on a
closing basis).
-Trading Days since Top: 205-days.
The S&P 500 is 7.1% Below its 200-dMA & 0.7%
Below its 50-dMA.
*I won’t call the correction over until the S&P 500
makes a new-high; however, evidence suggests the bottom was / is in the 3600
area and I am fully invested with a higher percentage of stocks than normal.
MY TRADING POSITIONS:
XLI – Industrial ETF
QLD – 2x Nas 100
DDM – 2x Dow 30
XLK – Technology ETF
CVX – (I may hold this as a long-term position. I already
owned a small position in CVX.)
TODAY’S COMMENT:
In theory, the S&P 500 was rejected at its 50-dMA and
fell from there giving a bearish signal. Sorry, I don’t buy that analysis. Market Internals looked very good today and VIX
was down; I expect that the major indeces will follow higher, either tomorrow
or very soon thereafter. Futures are up as I write this, so others are agreeing
with me.
Today, the daily sum of 20 Indicators sllipped from +17
to +16 (a positive number is bullish; negatives are bearish); the 10-day
smoothed sum that smooths the daily fluctuations improved from +73 to +92. (The
trend direction is more important than the actual number for the 10-day value.)
These numbers sometimes change after I post the blog based on data that comes
in late. Most of these 20 indicators are short-term so they tend to bounce
around a lot.
LONG-TERM INDICATOR: The Long
Term NTSM indicator remained BUY: VIX is neutral; SENTIMENT, PRICE & VOLUME
are bullish.
Bottom line: I’m a Bull: I’m now invested with about 75%
of the portfolio invested in stocks. (As a retiree, 50% invested in stocks is
my “normal” portfolio.) 75% stocks is uber-bullish and that’s as far as I’ll
go.
BEST ETFs - MOMENTUM ANALYSIS:
TODAY’S RANKING OF 15 ETFs
(Ranked Daily)
ETF ranking follows:
The top ranked ETF receives
100%. The rest are then ranked based on their momentum relative to the leading
ETF.
#1. XLE #2. ITA #2. IBB (ITA &
IBB Tied)
*For additional background on
the ETF ranking system see NTSM Page at…
http://navigatethestockmarket.blogspot.com/p/exchange-traded-funds-etf-ranking.html
BEST DOW STOCKS - TODAY’S MOMENTUM
RANKING OF THE DOW 30 STOCKS (Ranked Daily)
DOW 30 momentum ranking
follows:
#1. CVX #2. MRK #3. AMGN
The top ranked Stock receives
100%. The rest are then ranked based on their momentum relative to the leading Stock.
For more details, see NTSM
Page at…
https://navigatethestockmarket.blogspot.com/p/a-system-for-trading-dow-30-stocks-my_8.html
WEDNESDAY MARKETY INTERNALS
(NYSE DATA)
My basket of Market Internals remained BUY.
(Market Internals are a decent trend-following
analysis of current market action, but should not be used alone for short term
trading. They are most useful when they diverge from the Index.)
...My current invested
position is about 75% stocks, including stock mutual funds and ETFs. I’m
usually about 50% invested in stocks. I’ll cut back on stocks if we see serious
bear signs.
I trade about 15-20% of the
total portfolio using the momentum-based analysis I provide here. If I can see
a definitive bottom, I’ll add a lot more stocks to the portfolio using an
S&P 500 ETF.
“Trade what you see; not what you think.” – The Old Fool,
Richard McCranie, trader extraordinaire.
“For decades we disagreed with [Supreme] Court rulings
when progressives held sway, but we never called the Court illegitimate. But
now that the left has lost the Court as a backup legislature for its policy
goals, the institution is supposedly broken. Tell us again who is the threat to
democratic institutions?” – WSJ Editorial Board.
CONSUMER CONFIDENCE (Conference Board via PRnewswire)
“The Conference Board Consumer Confidence Index®
decreased in October after back-to-back monthly gains. The Index now stands at
102.5 (1985=100), down from 107.8 in September..."Consumer confidence
retreated in October, after advancing in August and September," said Lynn Franco, Senior Director of Economic Indicators at
The Conference Board. "The Present Situation Index fell sharply,
suggesting economic growth slowed to start Q4. Consumers' expectations
regarding the short-term outlook remained dismal. The Expectations Index is
still lingering below a reading of 80—a level associated with
recession—suggesting recession risks appear to be rising." Press release at...
https://www.prnewswire.com/news-releases/us-consumer-confidence-declined-in-october-301658584.html
MARKET REPORT / ANALYSIS
-Tuesday the S&P 500 rose about 1.6% to 3859.
-VIX dipped about 5% to 28.46.
-The yield on the 10-year Treasury slipped to 4.103%.
PULLBACK DATA:
-Drop from Top: 20.8 19.5% as of today. 25.4% max (on a closing
basis).
-Trading Days since Top: 203 204-days.
The S&P 500 is 8.1 6.5% Below its 200-dMA & 2.1 0.2%
Below its 50-dMA.
*I won’t call the correction over until the S&P 500
makes a new-high; however, evidence suggests the bottom was / is in the 3600
area and I am fully invested with a higher percentage of stocks than normal.
MY TRADING POSITIONS:
XLI – Industrial ETF
QLD – 2x Nas 100
DDM – 2x Dow 30
XLK – Technology ETF
CVX – (I may hold this as a long-term position. I already
owned a small position in CVX.)
TODAY’S COMMENT:
There are very few bear signs now: Bollinger Bands are overbought, but RSI is not. On the bullish side, there have only been 9 up-days
in the last month and 6 up-days in the last 10-days Neither are particularly bearish, so the
rally should be able to continue at the current pace as FOMO (Fear of Missing
Out) continues. My VIX indicator finally dropped into neutral territory. The
5-10-20-Timer flipped to the bullish side. Smart Money is buying. I still have
three Bottom Indicators that are bullish: Sentiment; Breadth vs the S&P
500; and the 50-day Fosback Logic Indicator. Woo-hoo. “Looking good, Billy Ray;
Feeling good, Lewis.”
Will Microsoft spoil the party? MSFT beat on revenues and
earnings, but cloud revenues were weak. Alphabet (Google) missed on revenues
and earnings. We’ll see, but in the near term, investors gave us a buy signal
in late September and that signal won’t be negated soon unless indicators
drastically fall. I don’t expect that they will.
Today, the daily sum of 20 Indicators rose from +16 to +17
(a positive number is bullish; negatives are bearish); the 10-day smoothed sum
that smooths the daily fluctuations improved from +62 to +73. (The trend
direction is more important than the actual number for the 10-day value.) These
numbers sometimes change after I post the blog based on data that comes in
late. Most of these 20 indicators are short-term so they tend to bounce
around a lot.
LONG-TERM INDICATOR: The Long
Term NTSM indicator remained BUY: VIX is neutral; SENTIMENT, PRICE & VOLUME
are bullish.
Bottom line: I’m a Bull: I’m now invested with about 75%
of the portfolio invested in stocks. (As a retiree, 50% invested in stocks is
my “normal” portfolio.) 75% stocks is uber-bullish and that’s as far as I’ll
go.
BEST ETFs - MOMENTUM ANALYSIS:
TODAY’S RANKING OF 15 ETFs
(Ranked Daily)
ETF ranking follows:
The top ranked ETF receives
100%. The rest are then ranked based on their momentum relative to the leading
ETF.
#1. XLE #2. ITA #3. IBB
*For additional background on
the ETF ranking system see NTSM Page at…
http://navigatethestockmarket.blogspot.com/p/exchange-traded-funds-etf-ranking.html
BEST DOW STOCKS - TODAY’S MOMENTUM
RANKING OF THE DOW 30 STOCKS (Ranked Daily)
DOW 30 momentum ranking
follows:
#1. CVX #2. AMGN #3. JPM
The top ranked Stock receives
100%. The rest are then ranked based on their momentum relative to the leading Stock.
For more details, see NTSM
Page at…
https://navigatethestockmarket.blogspot.com/p/a-system-for-trading-dow-30-stocks-my_8.html
TUESDAY MARKET INTERNALS (NYSE
DATA)
My basket of Market Internals remained BUY.
(Market Internals are a decent trend-following
analysis of current market action, but should not be used alone for short term
trading. They are most useful when they diverge from the Index.)
...My current invested
position is about 75% stocks, including stock mutual funds and ETFs. I’m
usually about 50% invested in stocks. I’ll cut back on stocks if we see serious
bear signs.
I trade about 15-20% of the
total portfolio using the momentum-based analysis I provide here. If I can see
a definitive bottom, I’ll add a lot more stocks to the portfolio using an
S&P 500 ETF.
“Trade what you see; not what you think.” – The Old Fool,
Richard McCranie, trader extraordinaire.
“For decades we disagreed with [Supreme] Court rulings
when progressives held sway, but we never called the Court illegitimate. But
now that the left has lost the Court as a backup legislature for its policy
goals, the institution is supposedly broken. Tell us again who is the threat to
democratic institutions?” – WSJ Editorial Board.
IHS COMPOSITE MANUFACTURING / SERVICES PMI (S&P
Global)
“Private sector firms in the US recorded a further
downturn in output at the start of the fourth quarter, according to latest
‘flash’ PMI™ data from S&P Global. The fall in business activity was solid
and stronger than that seen in September, as service providers signaled a
quicker decline. Manufacturers, on the other hand, saw output rise for the
second month running, albeit only marginally. The headline Flash US PMI
Composite Output Index registered 47.3 in October, down from 49.5 in September.
With the exception of the initial pandemic period, the rate of decrease was the
second-fastest since 2009.” Press release at...
https://www.pmi.spglobal.com/Public/Home/PressRelease/add9c8d7702e49c3ab0c3bbfa1822944
MORE SIGNS OF A BOTTOM (Heritage Capital)
“I saw a tweet from Wall Street Journal and Fed insider
Nick Timiraos...Today [Friday, 21 Oct] we learned that the Fed may move from
3/4% hikes to 1/2% hikes as soon as December. The anticipated 3/4% rise in
November remains. Is this the long-awaited pivot from the Fed? It’s too early
to tell, but as I have been saying and writing, it [will] take 6-9 months for
the economy to feel Fed moves. That means the real economic damage remains in
front of us in 2023...
... the markets should find a low in Q4 which is right
now. And October has the highest likelihood of that occurring. We just have to
keep watching for confirmation signs like more buying stampedes and good
leadership. We absolutely need to see the 2-Year stop going up along with the
dollar. I am also keenly focused on high yield bonds which we started buying
earlier this week for the first time in a few months.” – Paul Schatz, President
Heritage Capital. Commentary at...
https://investfortomorrow.com/blog/more-signs-of-a-bottom-yankees-saying-goodbye/
MARKET REPORT / ANALYSIS
-Monday the S&P 500 rose about 1.2% to 3797.
-VIX bucked the trend and rose about 0.5% to 29.85.
-The yield on the 10-year Treasury slipped to 4.228%.
PULLBACK DATA:
-Drop from Top: 20.8% as of today. 25.4% max (on a
closing basis).
-Trading Days since Top: 203-days.
The S&P 500 is 8.1% Below its 200-dMA & 2.1%
Below its 50-dMA.
*I won’t call the correction over until the S&P 500
makes a new-high; however, evidence suggests the bottom was / is in the 3600
area and I am fully invested with a higher percentage of stocks than normal.
MY TRADING POSITIONS:
XLI – Industrial ETF
QLD – 2x Nas 100
DDM – 2x Dow 30
XLK – Technology ETF
CVX – (I may hold this as a long-term position. I already
owned a small position in CVX.)
TODAY’S COMMENT:
10-dMA of Breadth (% of stocks advancing on NYSE)
improved today to 51% indicating that over the last 10 days more than half of
the issues traded on the NYSE were positive.
That’s a good sign and it shows that more stocks are participating in the
advance. We really need to see the 100-dMA move above 50%. That would be strong evidence of an end to
the Bear Market. On the charts, we’d
also need to see the S&P 500 break above its 200-dMA.
The price action supports the view that investors are
more bullish now than they were a month ago. The S&P 500 is up 4% since
then. Volumes have been increasing, too, suggesting that the advance is likely
to be durable. Volume over the last month is 5% higher than the previous month
and 13% higher than it was 2 months ago, also reinforcing investor confidence.
Today, the daily sum of 20 Indicators jumped from +12 to
+16 (a positive number is bullish; negatives are bearish); the 10-day smoothed
sum that smooths the daily fluctuations improved from +54 to +62. (The trend
direction is more important than the actual number for the 10-day value.) These
numbers sometimes change after I post the blog based on data that comes in
late. Most of these 20 indicators are short-term so they tend to bounce
around a lot.
LONG-TERM INDICATOR: The Long
Term NTSM indicator improved to BUY: VIX is bearish; SENTIMENT, PRICE &
VOLUME are bullish. The Long-Term
indicator can be slow to turn. It would be more comforting if the VIX indicator
would also turn bullish.
Bottom line: I’m a Bull: I’m now invested with about 75%
of the portfolio invested in stocks. (As a retiree, 50% invested in stocks is
my “normal” portfolio.) 75% stocks is uber-bullish and that’s as far as I’ll
go.
BEST ETFs - MOMENTUM ANALYSIS:
TODAY’S RANKING OF 15 ETFs
(Ranked Daily)
ETF ranking follows:
The top ranked ETF receives
100%. The rest are then ranked based on their momentum relative to the leading
ETF.
#1. XLE #2. ITA #3. IBB
*For additional background on
the ETF ranking system see NTSM Page at…
http://navigatethestockmarket.blogspot.com/p/exchange-traded-funds-etf-ranking.html
BEST DOW STOCKS - TODAY’S MOMENTUM
RANKING OF THE DOW 30 STOCKS (Ranked Daily)
DOW 30 momentum ranking
follows:
#1. CVX #2. MRK #3. AMGN
The top ranked Stock receives
100%. The rest are then ranked based on their momentum relative to the leading Stock.
For more details, see NTSM
Page at…
https://navigatethestockmarket.blogspot.com/p/a-system-for-trading-dow-30-stocks-my_8.html
MONDAY MARKET INTERNALS (NYSE
DATA)
My basket of Market Internals improved to BUY.
(Market Internals are a decent trend-following
analysis of current market action, but should not be used alone for short term
trading. They are most useful when they diverge from the Index.)
...My current invested
position is about 75% stocks, including stock mutual funds and ETFs. I’m
usually about 50% invested in stocks. I’ll cut back on stocks if we see serious
bear signs.
I trade about 15-20% of the
total portfolio using the momentum-based analysis I provide here. If I can see
a definitive bottom, I’ll add a lot more stocks to the portfolio using an
S&P 500 ETF.