Wednesday, October 31, 2012

Stock Market Headed Higher?

FAILED TEST SUGGESTS MOVE HIGHER (from MarketWatch)
by L.A. Little, professional money manager
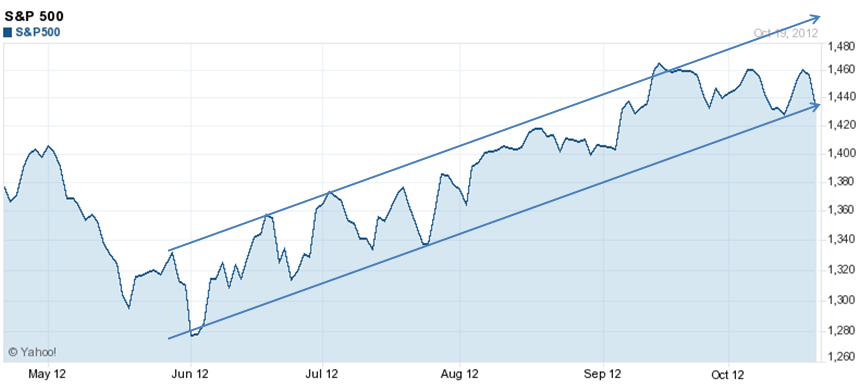
“As for this long-running bull market, we all know that it will eventually meet its demise. My guess is that this most likely occurs as a result of the ill-advised medications we are taking to alter the effects of the even more ill-advised and long-running policies previously pursued that created all of this unserviceable debt. It is always a matter of timing, though, and as we have seen so many times, it is hard to step back and declare the bull market dead prematurely.

In fact, I write today because it has reached another juncture where another push higher is highly probable.”  Full comment at…
http://www.marketwatch.com/story/failed-test-suggests-move-higher-2012-10-31?dist=tbeforebell

MARKET INTERNALS
The market internals measures of Breadth and New-Highs vs. New-lows both
have now flattened and are no longer pointing down.  They’re not pointing up either, but flat is better than down.  I am anxiously watching to see if this will be a continuing trend.
 
MARKET RECAP                                                                               
Wednesday the S&P 500 remained unchanged at 1412 (rounded) and VIX rose about 4-1/2% to 18.60.  

The pros continue to buy in late-day trading and that may indicate more positive days ahead.  As I note in the NTSM paragraph below, however; the news isn’t all good.

NTSM
The NTSM analysis remained HOLD Wednesday, but the NTSM indicators deteriorated and could still switch to sell in relatively short order. 

MY INVESTED POSITION
Based on the BUY signal, 6 July, I moved back into the market on 9 July (after the weekend) at S&P 500 1352. 

I currently have a 50% stock allocation overall.  For my age, that is what many advisors recommend as a fully invested position, however, I am normally much more aggressive.  I have less invested in stocks now because there’s a lot of risk.

Monday, October 29, 2012

A New Age of American Prosperity

THE TELEGRAPH
Europe left behind as shale shock drives America’s industrial resurgence
By Ambrose Evans-Pritchard
“…the US energy department said last week that the country will produce 11.4m barrels a day (b/d) of oil, biofuels, and liquid hydrocarbons next year, almost as much as Saudi Arabia.

America looks poised to become the world’s biggest producer in 2014. It will approach the Holy Grail of "energy independence" before the end of the decade.

This is largely due to hydraulic fracturing - blasting rock with water jets - to extract shale gas and oil, though solar power and onshore wind are playing their part.

Europe is going in the opposite direction, drifting towards energy suicide. So is Japan as it shuts down its nuclear industry after the Fukushima disaster….

The implications are momentous. America will no longer need a single drop of oil from the Islamic world. The strategic burden will fall on Europe, which is meekly disarming itself to meet Wolfgang Schauble's austerity targets. Russia and China will be pleased to help...”


HUSSMAN
John Hussman, PhD, is still suggesting the US is in recession, even with the latest GDP number at 2%.  

“…early GDP figures are often reported positive even after a recession is already well in progress, and waiting for two consecutive quarterly declines in GDP is a poor way of gauging recession risk, because that pattern sometimes doesn’t emerge until a much later revision, if at all.”

“Based on the most leading economic signal that we infer from dozens of economic variables…the best we can say about recent data is that the signal is negative but the pace has not worsened, which suggests that at least over the next 4-5 months, the character of the recession is likely to be moderate, and not the sort of off-the-cliff collapse we saw in 2008...”  He noted that GDP is usually positive in the beginning of recessions.  He wrote, “The heavy revision of GDP figures is not the exception but the rule. In the first quarter of 2008…with the U.S. economy already in recession for three months, Q1 GDP was reported at 1% growth. That figure was later revised to -1.8%. Just like 2001, the following quarter was reported at positive growth. The economy then collapsed in the second half of 2008, but by the time that was evident in GDP figures, the stock market had already plunged."  John Hussman Weekly Market Commentary from Hussman Funds at…

The markets were closed today, Monday, due to Sandy and will remain closed Tuesday so no Blog for me Tuesday.

Sandy is a monster for the Northeast where direct hits by hurricanes are relatively rare.  If you are in the impact area, I wish you the best.

Friday, October 26, 2012

GDP UP - Market Internals Slowly Deteriorating

BREAKOUT (An upbeat interview) GDP vs. Earnings
Mark Lehmann, president of JMP Securities: “…things seem darker than they really are…”

“This morning's first read on Gross Domestic Product for Q3 came in at 2%, and University of Michigan Consumer Sentiment index for October was in at 82.6; a five-year high.”

“Away from government data and surveys, which is to say "in the real world," markets are on the slide and corporate earnings relative to expectations are a disaster.”

“….Lehman says to stick with stocks and stay domestic. 2013 and beyond are going to be much better than expected, as he sees it, carried by "big macro tailwinds." An obsession with the fiscal cliff and a tight election — and all the uncertainty created by both — is making things seem darker than they really are, at least as Lehman sees it.”  Video interview at…
http://finance.yahoo.com/blogs/breakout/good-economic-data-meets-bad-earnings-one-wrong-162608879.html

My comment: Maybe…People buy stocks based on the expectation that earnings and dividends will grow.  Falling earnings should mean falling stock prices so the earnings picture is worrisome.

MARKET INTERNALS
The market internals measures of Breadth (%-stocks advancing) and New-Highs vs. New-lows both continue to deteriorate on a longer term basis, i.e., a look at measures of new-highs/lows over the last 2-months and breadth over generally the same time frame shows that the markets are actually deteriorating slowly.  Fewer stocks are going up.  This trend isn’t good since sooner or later, the markets are likely to follow the underlying trend.  Unfortunately, I haven’t been able to find a good buy/sell signal using the market internals – it just represents the general cautionary note I have made before: a correction still seems to be out there, I just can’t say when.  Or to clarify, the NTSM analysis will give a sell signal if market conditions worsen; I just can’t predict when (or if) that will happen.  

MARKET RECAP                                                                               
Friday the S&P 500 fell a point to 1412 (rounded) and VIX fell about 1-3/4% to 17.81.   

NTSM
The NTSM analysis remained HOLD Friday.

MY INVESTED POSITION
Based on the BUY signal, 6 July, I moved back into the market on 9 July (after the weekend) at S&P 500 1352. 

I currently have a 50% stock allocation overall.  For my age, that is what many advisors recommend as a fully invested position, however, I am normally much more aggressive.  I have less invested in stocks now because there’s a lot of risk.


Thursday, October 25, 2012

Hope for the Future: CEOs & the Debt


DEBT
“To achieve economic and financial stability, U.S. fiscal policy must be placed on a sustainable path that ensures that debt relative to national income is at least stable or, preferably, declining over time. Attaining this goal should be a top priority.” – Ben Bernanke


Politicians haven’t been paying attention, but CEOs of America’s companies are.  They are joining together asking Washington to take action.

DEBT
Political Watch – “Top CEOs urge debt deal in Washington — including tax revenue
October 25, 2012, 8:54 AM”
“Chief executives, presidents and chairmen and chairwomen of more than 80 top U.S. corporations are calling on Congress to use a mix of spending cuts and tax-revenue increases to curb the nation’s deficit, The Wall Street Journal reported early Thursday, citing an open letter due to be released later in the day.” Commentary at…
http://blogs.marketwatch.com/election/2012/10/25/top-ceos-urge-debt-deal-in-washington-including-tax-revenue/

MARKET RECAP                                                                               
Thursday the S&P 500 rose 1/3%, to 1413 (rounded) and VIX fell a little more than 1% to 18.12.   

NTSM
The NTSM analysis remained HOLD Thursday.

Indicators are slowly improving.  Market internals are mildly negative, but the market was up in the last hour of trading as the pros are buying.  It would appear that we avoided a correction, or at least it has been postponed. 

MY INVESTED POSITION
Based on the BUY signal, 6 July, I moved back into the market on 9 July (after the weekend) at S&P 500 1352. 

I currently have a 50% stock allocation overall.  For my age, that is what many advisors recommend as a fully invested position, however, I am normally much more aggressive.  I have less invested in stocks now because there’s a lot of risk.

Wednesday, October 24, 2012

Stock Market Collapse? Cyclicals Don’t Agree!

You would expect that if the stock markets were starting a major correction, the cyclical stocks (those that do poorly in recession) and transports (the shippers who are moving the freight) should be falling faster than the S&P 500.  That’s not the case.  The Morgan Stanley Cyclical Index is handily outperforming the S&P 500 over both the short and long term (anywhere from 2% to 5% depending on the time frame).  Over the past 2-weeks, the cyclicals are actually up 2%.  Transports haven’t confirmed anything either.  The conclusion?  The market pros aren’t betting on a market collapse – perhaps they’re just shearing the sheep.

My smart money indicator that tracks the last hour of trading agrees.  Although it wasn’t true today, since early October the pros have been buying in the afternoon.

FOR FEDERAL EMPLOYEES
Since the large cap multi-national stocks are the ones that have reported poor earnings, it may be worthwhile to shift into smaller cap stocks.  For Government employees in the TSP, that would mean shifting to the S-fund (Wilshire 4500) and out of the C-Fund (S&P 500).  Over the past month the Wilshire 4500 is exactly even with the S&P 500, but that may not continue due to revenue shortfalls associated with the slow-down overseas.  Since TSP only allows limited moves per month, it would be best to make the switch at the end of October.  That’s my plan, assuming the NTSM system doesn’t give me a sell signal in the interim. 

MARKET RECAP                                                                               
Wednesday the S&P 500 fell 1/3%, to 1409 (rounded) and VIX fell 2-2/3% to 18.33.   

VIX is not indicating a lot of fear now, so as I noted yesterday VIX is not confirming a correction.

NTSM
The NTSM analysis remained HOLD Wednesday.

MY INVESTED POSITION
Based on the BUY signal, 6 July, I moved back into the market on 9 July (after the weekend) at S&P 500 1352. 

I currently have a 50% stock allocation overall.  For my age, that is what many advisors recommend as a fully invested position, however, I am normally much more aggressive.  I have less invested in stocks now because there’s a lot of risk.

Tuesday, October 23, 2012

Valuation as a Percent of GDP

Here’s an article regarding valuation that is Halloweenish – scary… scary… scary

STOCK VALUATION AS A % OF GDP
Here's a bit of scary food-for-thought from Ned Davis Research as reported by John Hussman, PhD, Hussman Funds, in his weekly market comment for 22 October at (http://www.hussmanfunds.com/)
 
Stock market capitalization as a share of GDP
Historical average: 60%
Before the 73-74 collapse: 80%
Before the 1929 crash: 86%
Today: 105%
 
The missing piece of information is the value at the 2000 top. I found the answer at The Big Picture By Barry Ritholtz.  Price as a %-of GDP was 180% so the fact that it is now 105% is not an indication of imminent collapse; but it is cause for concern. 


There are bigger worries.  As the chart below shows, the value of the Market Capitalization divided by GDP has been falling since 2001.  What is really scary is that in past market bottoms, the ratio has been in the range of 20-40%.  The optimistic end of that range would put the S&P 500 value below 600 at the bottom of the next cycle.  Pardon me while I swoon a little.  (My personal prediction is 850 as a low, but I certainly don’t know when/or if that will happen.) 

 
from The Big Picture By Barry Ritholtz - July 24th, 2012,
http://www.ritholtz.com/blog/2012/07/market-capitalization-as-a-percentage-of-gdp-2/

MARKET RECAP                                                                               
Tuesday the S&P 500 fell 1.4%, to 1413 (rounded) and VIX ROSE 13% to 18.80.

NTSM
The NTSM analysis remained HOLD Tuesday…

…but another day like today will probably send it over to the sell side.  (I was surprised it didn’t today.)

It was close today and I was tempted to say “close enough” and sell out.  I didn’t, because I don’t really know what will happen and neither do the pundits.  I heard several on CNBC calling for a major crash and an equal number screaming “Buy!”

It does appear that a correction is underway, but the VIX is not confirming it yet.  Since the S&P 500 is now only less than 3% above the 200-dMA, I am going to wait for the NTSM system to actually signal a sell rather than jumping the gun on a close call.  That, to an extent, would be reacting to emotion.  This system is about discipline.  As always, I hope I am right because I hate being wrong.  I am also painfully aware that just because this system has worked in the past, it may not work tomorrow.

MY INVESTED POSITION
Based on the BUY signal, 6 July, I moved back into the market on 9 July (after the weekend) at S&P 500 1352. 

I currently have a 50% stock allocation overall.  For my age, that is what many advisors recommend as a fully invested position, however, I am normally much more aggressive.  I have less invested in stocks now because there’s a lot of risk.

Monday, October 22, 2012

Stock Market on the Edge

The market usually advances (or declines) within a band marked by lines (trend lines) connecting its highs and lows.  That “channel” is currently depicted below and as expected, it is about 5% (measured vertically) from top to bottom.

The S&P 500 is now at its lower trend line.  If it falls much further it will signal a change in trend and selling will pick up.  Currently, the trend is still up so no panic yet.  The “stall” around 1460 is quite evident on the chart.

 
Chart from Yahoo
http://finance.yahoo.com/q?s=%5EGSPC
annotated by NTSM

MARKET RECAP                                                                               
Monday the S&P 500 was UP a whisker, but basically unchanged at 1434 (rounded) and VIX FELL 2-1/2% to 16.62.

NTSM
The NTSM analysis remained HOLD Monday. 

If the S&P 500 significantly breaks the lower trend line, I expect that the NTSM analysis would switch to sell fairly quickly depending on the action in Volume and/or VIX.  Conversely, if the S&P 500 moves up from here NTSM will probably turn more positive.  There is no chart component in the NTSM system; that’s just the way the numbers are working.

MY INVESTED POSITION
Based on the BUY signal, 6 July, I moved back into the market on 9 July (after the weekend) at S&P 500 1352. 

I currently have a 50% stock allocation overall.  For my age, that is what many advisors recommend as a fully invested position, however, I am normally much more aggressive.  I have less invested in stocks now because there’s a lot of risk.

If the NTSM system indicates sell, I will move to zero percent invested in stocks.  Others may choose to stay partially invested in stocks without too much damage to their portfolio if the invested % is low.  For example, if one were to keep 30% invested in stocks and the market crashed by 50%, the loss to the portfolio would only be 15%.  If that is your plan, keep the low-beta stocks (those with lower P/E ratios) such as utilities, or consumer staples.  Sell technology.  Keeping 30% invested in stocks hedges the bet if I am wrong and the market continues up after a sell signal.  This is premature, of course.  The market may just turn up from here. 

Friday, October 19, 2012

NTSM is still HOLD; but just barely

Spain Banks Face Pain as Worst-Case Scenario Turns Real (Bloomberg)
Spain’s banks face more loan losses as the pace of an economic slump risks turning a worst-case scenario dismissed in stress tests into reality….Bad loans as a proportion of total lending jumped to a record 10.5 percent in August from a restated 10.1 percent in July as 9.3 billion euros ($12.2 billion) of loans were newly classified as being in default, according to data published by the Bank of Spain on its website today. The ratio has climbed for 17 straight months from 0.72 percent in December 2006, before Spain’s property boom turned to bust.”  Full story at…
http://www.bloomberg.com/news/2012-10-17/spain-banks-face-more-losses-as-worst-case-scenario-turns-real.html

The headline is probably worse than the article, but the take away here is that risks are still in Europe even if Spain did have a good bond auction earlier this week.

MARKET LEADERS ARE FALLING
Here in the U.S., the fall in the NASDAQ is a concern because when the market leaders begin falling (and other leaders join them), the market as a whole must follow.  It isn’t just the NASDAQ.  GE reported falling revenue yesterday and GE fell 3-1/2% pulling the DOW down today too.

The question here is, “Will the leaders continue down?”  My guess is, “Yes,” so I’ll be on alert to see if there is a change to the NTSM analysis.  I never trade on guesses, though.

PRICE ACTION
Since the market made a recent top of 1466 on 14 September, the S&P 500 has made 1461 5-times without getting over that level.  I wondered awhile back if the S&P 500 had topped (http://navigatethestockmarket.blogspot.com/2012/10/have-we-seen-top-alcoa-and-peter-schiff.html)

I thought then that 1461 looked like a top and I still think it is, but remember, trade what you see not what you think.  So I’ll crunch the numbers and see what the numbers show.  As of today, the numbers are neutral.

WHEN IN DOUBT – CHECK THE CHART
The chart shows the uptrend is still intact; but just barely.  It is now slightly below the lower trend line.

MARKET RECAP                                                                               
Friday the S&P 500 was DOWN 1-2/3% to 1433 (rounded) and VIX was UP 13-1/2% to 17.06.

NTSM
The NTSM analysis remained HOLD Friday, but again, just barely. 

There was some strong selling today and my panic indicator flashed sell, so now I have 1-indicator in the sell mode.  The rest are neutral.

The NTSM analysis could easily switch to sell next week.  Of course, if the market turns up, it could just as easily remain hold.   

MY INVESTED POSITION
Based on the BUY signal, 6 July, I moved back into the market on 9 July (after the weekend) at S&P 500 1352. 

I currently have a 50% stock allocation overall.  For my age, that is what many advisors recommend as a fully invested position, however, I am normally much more aggressive.  I have less invested in stocks now because there’s a lot of risk.

Thursday, October 18, 2012

Covering the Basics

It’s a busy day today so I’ll cover the basics.

MARKET RECAP                                                                               
Thursday the S&P 500 was DOWN 1/4% to 1457 (rounded) and VIX was also down 1/4% to 15.03.

NTSM
The NTSM analysis remained HOLD Thursday. 

The Price indicator is buy – up days have been bigger than the down days.  All other indicators are neutral.

MY INVESTED POSITION
Based on the BUY signal, 6 July, I moved back into the market on 9 July (after the weekend) at S&P 500 1352. 

I currently have a 50% stock allocation overall.  For my age, that is what many advisors recommend as a fully invested position, however, I am normally much more aggressive.  I have less invested in stocks now because there’s a lot of risk.

Wednesday, October 17, 2012

Pundits Predicting Crash; Markets Heading UP

Another stock crash like 1987’s is inevitable – Mark Hulbert
This week is the 25th anniversary of the Oct. 19, 1987 Crash, when the Dow plunged 22.6%.   That’s the biggest 1-day drop ever when measured on a %-basis.

Mark Hulbert wrote that:  “A single-session drop of at least 20%...is predicted — over long periods — to occur once every 104 years, on average...”

Stated another way; the odds of a stock market crash are about one in a hundred for any given year.  Full commentary at...
http://www.marketwatch.com/story/another-stock-crash-like-1987s-is-inevitable-2012-10-17

Mark Hulbert is not predicting a crash now; but Michael Belkin is!

WSJ live - Markets  (VIDEO)
Michael Belkin Predicts 40% Stock Market Drop
Hedge Fund Consultant Michael Belkin spoke at The Big Picture conference, predicting a 40% stock market drop in the coming 12-15 months.”

“Michael Belkin says we are in recession now based on ECRI data and his own work.  The recession has been caused by Europe and Asia pressuring US corporate profits.  He said the average recession has lasted 15-months and has resulted in a 30% drop in stock prices when looking at the Dow.  He says there is a much greater risk for the NASDAQ because those companies rely heavily on overseas revenue.

He expects corporate earnings to be a “big disappointment” in the current reporting period.  To watch the video...
http://live.wsj.com/video/michael-belkin-predicts-40-stock-market-drop/A1C9660A-0321-4E82-BA0E-EFD4CD092D40.html?link=MW_hp_tboverticalx8#!A1C9660A-0321-4E82-BA0E-EFD4CD092D40

Let’s look at Corporate profits so far...

FROM FACTSET.COM
“Of the 32 companies that have reported earnings to date for Q3 2012, 63% have reported earnings above the mean estimate and 56% have reported sales above the mean estimate...
…Earnings Growth: The blended earnings growth rate for Q3 2012 is -2.6%. If -2.6% is the final growth rate for the quarter, it will mark the end of the eleven-quarter streak of earnings growth for the index…
…Earnings Guidance: For Q3 2012, 80 companies have issued negative EPS guidance and 23 companies have issued positive EPS guidance. If 78% (80 out of 103) is the final percentage of companies issuing negative EPS guidance for the quarter, it will be the highest percentage recorded by FactSet.”
http://www.factset.com/websitefiles/PDFs/earningsinsight/earningsinsight_10.12.12


These numbers don’t look very good, but the falling earnings numbers have been widely expected.  Factset noted in their report that the 12-month forward P/E is 12.9 vs. a 10-year average forward P/E of 14.3.  That means that earnings disappointments are, at least partly, already baked in the cake.

Nothing here means that ECRI, John Hussman, or Michael Belkin are wrong. 

From my perspective, I prefer to focus on the market’s reaction to the economy rather than trying to determine if it’s in recession or not. 

MARKET RECAP                                                                               
Wednesday the S&P 500 was UP 0.41% to 1461 (rounded) and VIX was down 1% to 15.07.

The most recent high was 1466 on 14 September.  That will be an important test point for this bull.  If the market can break decisively higher than 1466 then it may make it back to the 1550 prior highs.   

NTSM
The NTSM analysis remained HOLD Wednesday.

MY INVESTED POSITION
Based on the BUY signal, 6 July, I moved back into the market on 9 July (after the weekend) at S&P 500 1352. 

I currently have a 50% stock allocation overall.  For my age, that is what many advisors recommend as a fully invested position, however, I am normally much more aggressive.  I have less invested in stocks now because there’s a lot of risk.

Tuesday, October 16, 2012

Is the U.S. headed for a Doomsday Cycle?

I posted excerpts from this article before, but here’s a little more.

THE DOOMSDAY CYCLE TURNS: WHO’S NEXT (excerpts)
Simon Johnson (Professor of Entrepreneurship, Sloan School of Management, MIT), Peter Boone (Research Associate, Centre for Economic Performance, LSE),
21 September 2012
“The latest crisis has led to the largest monetary and fiscal bailouts on record. The Congressional Budget Office estimates that the final fiscal impact of the crisis of 2007-8 will end up increasing debt relative to GDP by about 50 percentage points. This is the second largest debt shock in US history; measured in this way, only the Second World War cost more. (For more detail, see Johnson and Kwak 2012.)”

“Roughly half of all US federal debt is currently held by non-residents. So US fiscal policy remains viable only as long as the dollar is seen as the ultimate safe haven for investors...A great deal of the prospects for the US budget and growth...rest on what happens in the Eurozone.”

(But) “...The continental European financial system is in big trouble: budgets are unsustainable and growth is nowhere on the horizon. The costs of bailouts are rising – and the coming scale of the problem is likely to undermine political support for the Eurozone itself.”

The risk is much greater than currently reported because of  “...the growth of euro-denominated interest rate derivatives, the notional value of which now totals more than 10 times the GDP of the Eurozone.  Regulators commonly use net figures when they consider ultimate risk for banks (the derivative contracts are offsetting and net to zero) and this makes sense under the usual circumstances of bankruptcy...But if investors start to believe that there will be new currencies in each country, then the...contracts...are no longer offsetting...”

“...The lesson from all these troubles is clear: the relatively recent rise of the institutions of complex financial markets, around the world, has permitted the growth of large, unsustainable finance. We rely on our political systems to check these dangers, but instead the politicians naturally develop symbiotic relationships that encourage irresponsible growth.

The nature of ‘irresponsible growth’ is different in each country and region – but it is similarly unsustainable and it is still growing. There are more crises to come and they are likely to be worse than the last one.”
Full story at...
http://www.voxeu.com/article/doomsday-cycle-turns-who-s-next

MARKET RECAP                                                                               
Tuesday the S&P 500 was UP 1% to 1455 (rounded) and VIX was down 1/3% to 15.22.

The pro-traders have been buying late in the day – that’s a positive turn. 

Traders have been paying-up for cyclical stocks too; apparently traders don’t believe a recession is in the offing. 

NTSM
The NTSM analysis remained HOLD Tuesday.

MY INVESTED POSITION
Based on the BUY signal, 6 July, I moved back into the market on 9 July (after the weekend) at S&P 500 1352. 

I currently have a 50% stock allocation overall.  For my age, that is what many advisors recommend as a fully invested position, however, I am normally much more aggressive.  I have less invested in stocks now because there’s a lot of risk.

Monday, October 15, 2012

Not everyone is a Keynesian; Is ECRI Correct?

From the Opinion page of the WSJ (13 Oct)
Zhang Weiying, Professor of Economics Peking University, PhD from Oxford, has been making speeches entitled, “Bury Keynesianism”.  He said, “…since the financial crisis was caused by easy money, it couldn’t be saved by the same...The current economy is like a drug addict, and the prescription from the doctor is morphine, so the final result will be much worse.”  Zhang follows the Hayek school of economics.  More on that subject later.  Let’s see some good news now.

GOOD NEWS - Doug Short questions ECRI Conclusions.
Doug Short at Advisor Perspective notes that the Economic Cycle research Institute's (ECRI) leading indicator data has turned up recently and he suggests (again) that they may have to revisit their recession call.  Remember, the ECRI started calling for recession over a year ago and as recently as 5 October I noted on this blog that the ECRI was still calling for recession.  For the story see...
http://www.advisorperspectives.com/dshort/
 
BAD NEWS - HUSSMAN STILL PREDICTING SIGNIFICANT MARKET DECLINES
John Hussman, Phd, uses ECRI data in some of his work and he remains convinced that the US economy is already in recession and his tone remains frightening at best.  I enjoy reading John Hussman's columns and I respect his analysis; but is he correct?  After nearly a year of reading his predictions for a significant market downturn, one begins to wonder.  Here's an excerpt from this week's weekly comment:
 
"On the basis of normalized earnings (which correct for the cyclicality of profit margins over the business cycle...our projection for 10-year S&P 500 total returns is lower than it has been at any point prior to the late-1990's bubble, with the exception of 1929. While it is very true that valuations have been even richer at various points in recent years, it should also be noted the S&P 500 (including dividends) has now underperformed Treasury bills for well over 13 years as a direct result...Hugh Hendry of Eclectica recently got the tone right in his concerns about the endgame we are facing:... 'I think we are single digit years away from the most profound market clearing moment - a 1932 or a 1982'..."  read the Weekly Market Comment from Hussman Funds at...
http://www.hussmanfunds.com/
 
Frankly, I have to agree with that assessment.  It seems unlikely that any of the politicians involved (here, Europe, Japan, or elsewhere) have the guts to deal with the debt-crisis or recession in a meaningful way.  Those who believe in Keynesian economics think the stimulus was far too little; the Hayek economists think that stimulus is part of the problem.  The Federal Reserve’s actions bring on spirited arguments on both sides too. 
 
I may have to read another year's worth of dire predictions from John Hussman before the issue is resolved - and we may not like the resolution.  As always, it’s easy to predict disaster – sooner or later some sort of disaster will happen – it’s the timing that is the hard part.  My own analysis is currently neutral.
 
MARKET RECAP                                                                               
Monday the S&P 500 was UP 3/4% to 1440 (rounded) and VIX was down more than 5% to 15.27.

Longer term measures of breadth and new-high/new low numbers are still pointing down.  Big up days (like today) are often followed by down-days.  In spite of that trend, futures are looking up as I write this so tomorrow will be interesting to see what happens. 

NTSM
The NTSM analysis remained HOLD Monday.

MY INVESTED POSITION
Based on the BUY signal, 6 July, I moved back into the market on 9 July (after the weekend) at S&P 500 1352. 

I currently have a 50% stock allocation overall.  For my age, that is what many advisors recommend as a fully invested position, however, I am normally much more aggressive.  I have less invested in stocks now because there’s a lot of risk.

Friday, October 12, 2012

Consumer Confidence UP

(Reuters) – “U.S. consumer sentiment unexpectedly rose to its highest in five years…
The Thomson Reuters/University of Michigan's preliminary October reading on the overall index on consumer sentiment came in at 83.1, up from 78.3 the month before, and the highest since September 2007, the survey showed on Friday.”
http://www.reuters.com/article/2012/10/12/us-usa-economy-sentiment-idUSBRE89B0U320121012

That’s an interesting number.  With so many issues facing consumers, it’s surprising to me too.

“Market Timing Will Cost You Big Time Says Dalbar’s Harvey”
(from YAHOO, BREAKOUT)
“…’We've looked at the effects of market timing for the last 20 years and on average these days (the cost to investors) is around 4 percentage points’…In fact, his research shows that during particularly volatile periods such as 2011, the average hit to a market timer's performance nearly doubled to 7%...”  Full story at…
http://finance.yahoo.com/blogs/breakout/research-shows-market-timing-cost-big-time-130824983.html

So while the average person who tried to time the market in 2011 under-performed the S&P 500 by 7%, the NTSM system outperformed by 12% - a swing of 19%.  That’s the benefit of an analytical system that takes emotion out of the picture. 

MARKET RECAP                                                                               
Friday the S&P 500 was DOWN 1/3% at 1433 (rounded) and VIX rose about 3-1/2% to 16.14.

The S&P 500 is still only about 1% below the lower trend line.  For me, that is not enough to say the trend is now down.   

At the top of 1466 on 14 September, the S&P 500 was about 9% above its 200-day moving average.  Corrections often start when the S&P gets in the range of 10-20% above the 200-dMA, so a correction now would not be a surprise, but it is also far from certain.  The NTSM numbers are still in neutral territory.

NTSM
The NTSM analysis remained HOLD Friday.

MY INVESTED POSITION
Based on the BUY signal, 6 July, I moved back into the market on 9 July (after the weekend) at S&P 500 1352. 

I currently have a 50% stock allocation overall.  For my age, that is what many advisors recommend as a fully invested position, however, I am normally much more aggressive.  I have less invested in stocks now because there’s a lot of risk.

Thursday, October 11, 2012

The Dumb Money is Buying…Time to Sell?

INDIVIDUALS ARE BUYING STOCKS (YAHOO.COM)
“After sitting out much of the more than 100% rally since the lows of 2009, individual investors are finally starting to put money to work in stocks. According to Josh Brown of theReformedBroker.com, the cash coming into the market shows a public not only eschewing hotshot money managers but also crushing them at their own game....Brown says $18 billion went into ETFs in September, and two-thirds of it was put into the SPDR S&P 500 ETF (SPY).”  Full story at…
http://finance.yahoo.com/blogs/breakout/individual-investors-beating-pros-own-game-josh-brown-171848031.html

As noted, Josh Brown is using ETF data, not just mutual fund data.  (The individual investor has not come back to Mutual Funds.)  This news looks like a major top may be getting near.  Who really knows?  The NTSM sentiment value is currently 51%-bulls, a neutral reading, so the sort of top signaled by late-comers arriving to the party is not confirmed by my sentiment data…not yet anyway

EMPLOYMENT from CNN/MONEY
NEW YORK (CNNMoney) – “Claims for unemployment benefits fell sharply last week to their lowest level in more than four years, but the drop was due mostly to a technical issue….About 339,000 people filed for first-time unemployment benefits in the week ended October 6, down 30,000 from the previous week, the Labor Department said Thursday…Much of the drop last week was caused by an anomaly, a Labor Department analyst told CNNMoney. One state posted a large decline in claims, which is not typical during the last week in September.”  Full story at…
http://money.cnn.com/2012/10/11/news/economy/unemployment-benefits/index.html?iid=HP_River

The key point here: “…the drop last week was caused by an anomaly…”  We’ll have to wait until next week to know what is going on with unemployment claims.

MARKET RECAP                                                                               
Thursday the S&P 500 was UP just a whisker, basically unchanged at 1433 (rounded) and VIX fell about 4% to 15.59.

NTSM
The NTSM analysis remained HOLD Thursday.

The NTSM Price indicator tracks the size of up vs. down movements in the stock market.  The Price indicator has been in positive territory for about 3-1/2 months.  Today it switched to neutral, so all of my indicators are now in neutral territory.  That brings the NTSM analysis closer to a sell signal, but there is no point in trying to guess which way the market will go from here.  It could simply turn back upward. 

At this point, longer term measures of market internals {breadth (numbers of stocks advancing) and stocks making new-highs vs. new lows} aren’t supporting an upswing.  I’ll be tracking the NTSM indicators carefully; a switch to a sell would not be surprising.

MY INVESTED POSITION
Based on the BUY signal, 6 July, I moved back into the market on 9 July (after the weekend) at S&P 500 1352. 

I currently have a 50% stock allocation overall.  For my age, that is what many advisors recommend as a fully invested position, however, I am normally much more aggressive.  I have less invested in stocks now because there’s a lot of risk.

Wednesday, October 10, 2012

Have we seen the top? Alcoa and Peter Schiff on the Fiscal Cliff

ALCOA from MarketWatch
"Alcoa('s)...adjusted earnings outpaced Wall Street's projections... its third-quarter earnings excluding charges were 3 cents a share...On a net basis, Alcoa swung to a net loss of...13 cents a share {due to charges associated with a lawsuit settlement}. In the year-ago period, the company earned...15 cents a share."  Full story at...
http://articles.marketwatch.com/2012-10-09/markets/34336000_1_alcoa-swings-alcoa-shares-forecast-for-global-aluminum
 

Alcoa's revenues were down about 10% and that doesn't reflect good economic conditions.  It shows the world economy is slowing, but really, that's not new news. 

FISCAL CLIFF from Yahoo Finance:
Peter Schiff,  Chief global strategist of Euro Pacific Capital Inc:
"...it's not necessarily the year-end cliff that could lead us into the next disaster.  It's not because we go over this phony fiscal cliff, it's probably because we don't go over that one because the government cancels the spending cuts, cancels the tax hikes, and instead we end up going over the real fiscal cliff further down the road," he says.
 
By kicking the can down the road, Schiff believes interest rates will spike and we won't be able to afford to pay the interest on the enormous amount of debt that we have. "In fact, the real fiscal cliff comes when our creditors want their money back, and we don't have it," he states.
 
Schiff says QE3 can only take us so far and the Federal Reserve's money printing will do so much destruction to the dollar through inflation, that we'll see a currency collapse like never before, which will force a dramatic and painful new way forward... "We can't keep avoiding the pain and in the process making the problem worse, because then we're just going to have even more pain in the future to fix an even bigger problem."  Full story at...
http://finance.yahoo.com/blogs/breakout/real-fiscal-cliff-much-bigger-think-warns-peter-131010466.html

HAS THE S&P 500 TOPPED?
(After yesterday’s blog, today’s shows that I’m feeling very schizophrenic.)

I commented on 27 September that there were indications of a calm-before-the-storm.  
http://navigatethestockmarket.blogspot.com/2012/09/gdp-down-durable-goods-orders-down.html 
I’ve noticed the top sometime occurs about a month after that “calm”.   That “calm” set up at the end of August.  The S&P recent top was 1466 on 14 September, and the S&P 500 was 1461 on 4 October, pretty close to a month after the calm.  The market internals are now trending down too.  In some respects, this does look like we’ve already seen the top. 

To counter that argument, there hasn’t been an uptick in volume that would normally confirm a downturn so the evidence is weak so far.   While there have been a couple of surveys of the investment pros calling for an end to the rally, that’s not a good indicator either.  Even though I said yesterday that the market usually does the opposite of what everyone says it will do, sometimes everyone is right.

MARKET RECAP                                                                               
Wednesday the S&P 500 was DOWN about 2/3% to 1433 (rounded) and VIX fell about 1/2% to 16.29.

The S&P 500 is now about 1% below its lower trend line.  Some traders would say the trend has been broken; Sell!  I’m still watching the NTMS analysis.

NTSM
The NTSM analysis remained HOLD Wednesday, stuck in neutral.

If we really have seen the top, VIX and Volume indicators should react quickly and signal a sell; so far, no dice.    

MY INVESTED POSITION
Based on the BUY signal, 6 July, I moved back into the market on 9 July (after the weekend) at S&P 500 1352. 

I currently have a 50% stock allocation overall.  For my age, that is what many advisors recommend as a fully invested position, however, I am normally much more aggressive.  I have less invested in stocks now because there’s a lot of risk.

Tuesday, October 9, 2012

Stock Market Rally Over? Probably not…

CNNMoney
The stock market rally is over
U.S. stock market has delivered quite the performance this year, thanks in large part to stimulus efforts by the world's central banks…But experts believe the robust gains are now remnants of the past. In fact, according to an exclusive CNNMoney survey of 37 investment strategists and money managers, the S&P 500 will finish 2012 at 1,440, up a healthy 15% for the year but in the exact same spot where it started the fourth quarter.”
http://money.cnn.com/2012/10/07/investing/stock-market-outlook/index.html?iid=HP_LN

As I have suggested before, when everyone thinks the stock market will move one way, it usually goes the other way.  So if everyone says it’s going down; it’s probably going up.

Still, as the article noted, there are many headwinds: election, fiscal cliff, Europe, just to name a few.

MARKET RECAP                                                                               
Tuesday the S&P 500 was about DOWN 1% to 1441(rounded) and  VIX rose about 8% to 16.3 a little before the close.

The S&P 500 is now on its lower trend line.  We’ll have to see if it drops lower.  If it does, say several percent lower, there should be some significant selling. 

NTSM
The NTSM analysis remained HOLD Tuesday although our best indicator (VIX) is drifting toward the sell end of neutral.   

(It would take more than VIX alone to send a sell signal.)

MY INVESTED POSITION
Based on the BUY signal, 6 July, I moved back into the market on 9 July (after the weekend) at S&P 500 1352. 

I currently have a 50% stock allocation overall.  For my age, that is what many advisors recommend as a fully invested position, however, I am normally much more aggressive.  I have less invested in stocks now because there’s a lot of risk.