“Chicago PMI fell to a reading of 63.6 in August from
65.5 in the prior month, MNI Indicators said. Any reading above 50 indicates
improving conditions…” Story at…
MICHIGAN SENTIMENT (Reuters)
“U.S. consumer sentiment fell to a seven-month low in
August as households worried about rising prices amid a robust economy and
tensions between the United States and its main trade partners.” Story at…
MARKET REPORT / ANALYSIS
-Friday the S&P 500 was up a tiny bit (0.01%), but I
rounded up and gave it a point to 2902.
-VIX dipped about 5% to 12.86.
-The yield on the 10-year Treasury rose slightly to 2.860%
as of the close.
Currently, my daily sum of 17 Indicators slipped from -1
to -5 (a positive number is bullish; negatives are bearish) while the 10-day
smoothed version that negates the daily fluctuations dipped from +45 to +42
indicating that conditions are worse than 2-weeks ago. Indicators continue to slip and have a
negative outlook at this point.
Bollinger Bands and the Overbought/Oversold Ratio have
cleared their overbought signal. RSI is creeping up and is now 75 which is not
far from the 80 required for it to be considered overbought (RSI, 14-day, SMA).
The most likely move from here would be a 3-5% pullback,
but further advance before a retreat is always possible.
Interestingly, the Pros are buying (based on late-day
action) and Sentiment was up yesterday showing that the Rydex traders were
buying the one-day dip. (Data for today still isn’t available as I write this.)
I can’t day that the dip-buyers are right.
There are too many negative signs to jump in now. On the other hand,
there aren’t enough bearish signs to require cutting stock holdings. I am already at a Balanced retiree 50% stock
position and we haven’t seen any signs warning of anything more than a small
normal pullback.
I remain fully invested.
MOMENTUM ANALYSIS:
TODAY’S RANKING OF
15 ETFs (Ranked Daily)

The top ranked ETF receives 100%. The rest are then
ranked based on their momentum relative to the leading ETF. While momentum isn’t stock performance per
se, momentum is closely related to stock performance. For example, over the
4-months from Oct thru mid-February 2016, the number 1 ranked Financials (XLF)
outperformed the S&P 500 by nearly 20%. In 2017 Technology (XLK) was ranked
in the top 3 Momentum Plays for 52% of all trading days in 2017 (if I counted
correctly.) XLK was up 35% on the year while the S&P 500 was up 18%.
*For additional background on the ETF ranking system see
NTSM Page at…
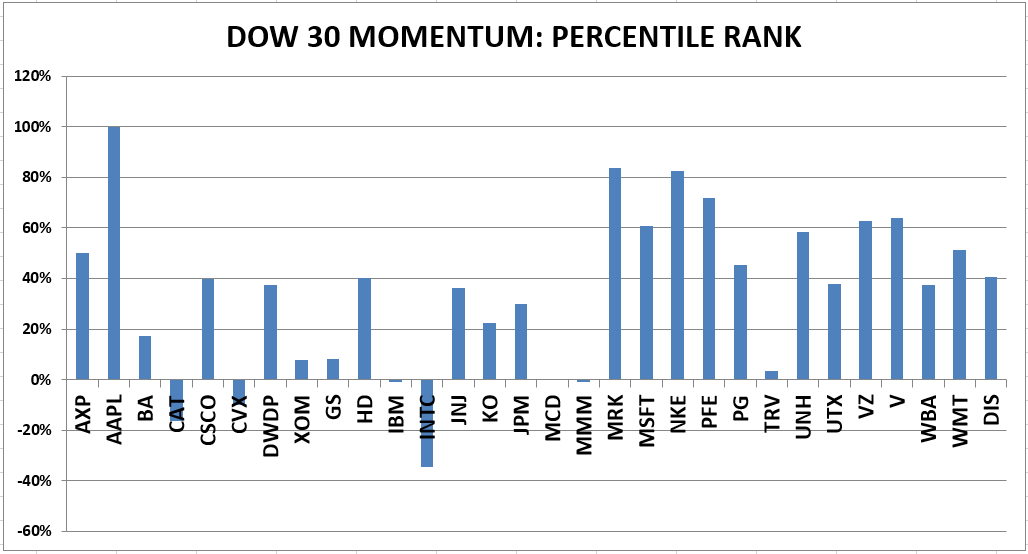
TODAY’S RANKING OF THE DOW 30 STOCKS (Ranked Daily)

The top ranked stock receives 100%. The rest are then
ranked based on their momentum relative to the leading stock.
*I rank the Dow 30 similarly to the ETF ranking system.
For more details, see NTSM Page at…
FRIDAY MARKET INTERNALS (NYSE DATA)
Market Internals remained
NEUTRAL on the market.
Market Internals are a decent trend-following analysis of
current market action but should not be used alone for short term trading. They
are usually right, but they are often late.
They are most useful when they diverge from the Index. In 2014, using these internals alone would
have made a 9% return vs. 13% for the S&P 500 (in on Positive, out on
Negative – no shorting).
I am now 50% invested in stocks. For me, fully invested
is a balanced 50% stock portfolio. As a retiree, this is a position with which
I am comfortable unless I am in full defense mode or feeling especially
optimistic.
INTERMEDIATE / LONG-TERM INDICATOR
Intermediate/Long-Term
Indicator: Friday, the Price indicator was positive; Volume, VIX &
Sentiment were neutral. Overall this is a NEUTRAL indication.