HAPPY NEW YEAR!

My cmt: Sorry…I should stick to the stock market. I
thought the cartoon was a hoot since the Weather Channel has been hyping the latest "named" winter storm.
CONSUMER CONFIDENCE (Conference Board)
“The Conference Board Consumer Confidence Index® decreased
marginally in December, following a slight increase in November. The Index now
stands at 126.5 (1985=100), down from 126.8 (an upward revision) in November… “Consumer
confidence declined marginally in December, following a slight improvement in
November,” said Lynn Franco, Director of Economic Indicators at The Conference
Board. “While consumers’ assessment of current conditions improved, their expectations
declined, driven primarily by a softening in their short-term outlook regarding
jobs and financial prospects. While the economy hasn’t shown signs of further
weakening, there is little to suggest that growth, and in particular consumer
spending, will gain momentum in early 2020.” Press release at…
GARTMAN LETTER (Bloomberg)
“Dennis Gartman plans to halt publication of “The Gartman
Letter” after more than three decades of producing his daily investor report. “There
comes a time when retirement calls,” Gartman wrote in Friday’s edition of the
newsletter.” Story at…
My cmt: Enjoy your retirement Dennis!!
MARKET REPORT / ANALYSIS
-Tuesday the S&P 500 rose about 0.3% to 3231.
-VIX dropped about 7% to 13.78.
-The yield on the 10-year Treasury rose to 1.920.
We finished the day and decade with a nice run higher
toward the close; the S&P 500 made its entire gain in the last hour. That’s
a bullish sign and the Smart Money Indicator that I track also indicates some
bullish moves ahead. Unfortunately, most indicators don’t agree.
My daily sum of 20 Indicators improved from -5 to
-4 (a positive number is bullish; negatives are bearish) while the 10-day
smoothed sum that negates the daily fluctuations declined from +16 to +8
(These numbers sometimes change after I post the blog based on data that comes
in late.) A reminder: Most of these indicators are short-term.
Volume stayed low today compared to last week; it was
still about 15% below the monthly average.
My MACD of Breadth is close to sending a bearish
signal. The same is true for the MACD of
S&P 500 price.
I remain bullish in the long-term; short-term - it looks
like we are in for a bit of a pullback. My guess is that the pullback will get
underway for real after the New Year rolls in. End of the month and the first
days of a new month are usually strong due to 401k automatic inflows. It could be a while before the market agrees
with my assessment; however, if the market gets further stretched, I may take a
small short position.
Any pullback should be small: there were a lot of
new-highs when the S&P 500 made its last all-time high; the Fosback
New-High/New-Low Logic Index is much closer to a buy than a sell.
TOP / BOTTOM INDICATOR SCALE OF 1 TO 10 (Zero is a
neutral reading.)
Today’s Reading: -3
Most Recent Day with a value other than Zero: -3 on 31
December (RSI was overbought; divergence between Breadth and the S&P 500 is
bearish; and the S&P 500 is too far above its 200-dMA when sentiment is
considered.
(1) +10 Max Bullish / -10 Max Bearish)
(2) -4 or below is a Sell sign. +4 or higher is a Buy
Sign.
MOMENTUM ANALYSIS:
TODAY’S RANKING OF
15 ETFs (Ranked Daily)

The top ranked ETF receives 100%. The rest are then
ranked based on their momentum relative to the leading ETF. While momentum isn’t stock performance per
se, momentum is closely related to stock performance. For example, over the
4-months from Oct thru mid-February 2016, the number 1 ranked Financials (XLF)
outperformed the S&P 500 by nearly 20%. In 2017 Technology (XLK) was ranked
in the top 3 Momentum Plays for 52% of all trading days in 2017 (if I counted
correctly.) XLK was up 35% on the year while the S&P 500 was up 18%.
*For additional background on the ETF ranking system see
NTSM Page at…
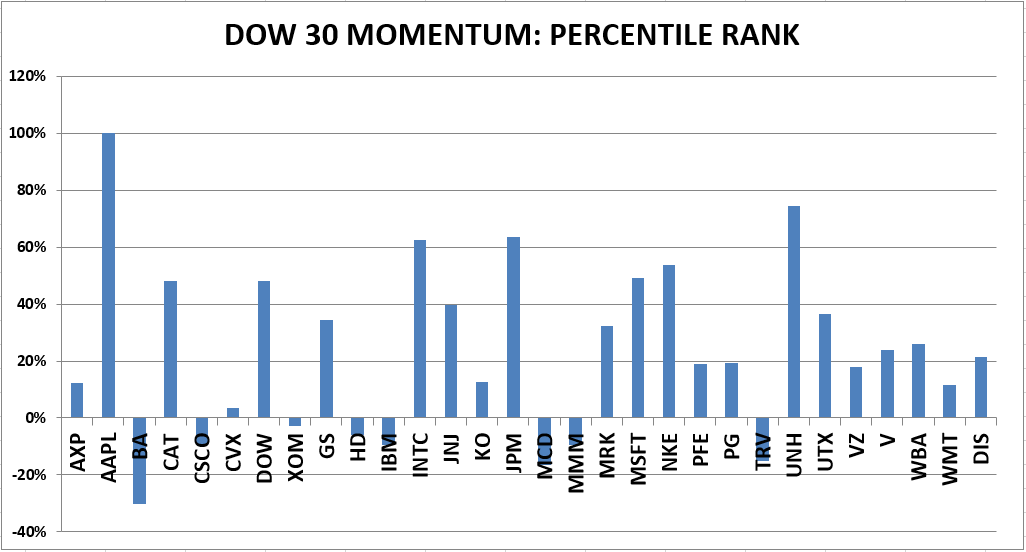
TODAY’S RANKING OF THE DOW 30 STOCKS (Ranked Daily)
The top ranked stock receives 100%. The rest are then
ranked based on their momentum relative to the leading stock.

TUESDAY MARKET INTERNALS (NYSE DATA)
Market Internals
remained NEUTRAL on the market.
Market Internals are a decent trend-following analysis of
current market action but should not be used alone for short term trading. They
are usually right, but they are often late.
They are most useful when they diverge from the Index. In 2014, using these internals alone would
have made a 9% return vs. 13% for the S&P 500 (in on Positive, out on
Negative – no shorting).
Using the Short-term indicator in 2018 in SPY would have
made a 5% gain instead of a 6% loss for buy-and-hold. The methodology was Buy
on a POSITIVE indication and Sell on a NEGATIVE indication and stay out until
the next POSITIVE indication. The back-test included 13-buys and 13-sells, or a
trade every 2-weeks on average.
My current stock allocation is about 60% invested in
stocks as of 7 Oct 2019 (up from 50%). This is a conservative balanced position
appropriate for a retiree. You may wish to have a higher or lower % invested in
stocks depending on your risk tolerance.
INTERMEDIATE / LONG-TERM INDICATOR
Tuesday, the PRICE indicator was Bullish; VIX, VOLUME
and SENTIMENT Indicators were neutral. Overall, the Long-Term Indicator slipped
to HOLD. At present, I expect a small pullback so we are looking for a
better buying opportunity.