“A measure of leading economic indicators declined in January to mark the second straight drop, mainly because of falling stock prices and somewhat higher jobless claims last month. The leading economic index dropped 0.2% to 123.2 last month…” Story at…
http://www.marketwatch.com/story/leading-economic-indicators-fall-for-second-month-in-a-row-2016-02-18
UNEMPLOYMENT CLAIMS (Bloomberg)
“The number of Americans filing for unemployment benefits unexpectedly declined last week to a three-month low, signaling durability in the labor market. Initial jobless claims dropped by 7,000 to 262,000 in the week ended Feb. 13…”
http://www.bloomberg.com/news/articles/2016-02-18/jobless-claims-in-u-s-decline-to-lowest-level-since-november
PHILADELPHIA FED (Marketwatch)
“A[n] early indication of manufacturing conditions in February indicated contraction for the sixth straight month, according to new data released Wednesday. The Philadelphia Fed said its manufacturing barometer of regional manufacturing activity rose slightly to negative 2.8 from negative 3.5.” Story at…
http://www.marketwatch.com/story/philly-fed-index-index-shows-manufacturing-contracts-for-sixth-straight-month-2016-02-18
CRUDE INVENTORIES UP (Bloomberg)
"Crude stockpiles rose 2.15 million barrels to 504.1 million last week, according to the Energy Information Administration. Imports climbed 11 percent, the biggest gain since April.” Story at…
http://www.bloomberg.com/news/articles/2016-02-17/oil-extends-gain-as-iran-backs-output-freeze-without-vowing-cuts
MARKET REPORT / ANALYSIS
-Thursday, the S&P 500 was down about 0.5% to 1918 at the close.
-VIX fell about 3% to 21.64.
-The yield on the 10-year Treasury fell to 1.76%.
STILL A DOWN TREND
The 200-dMA is still sloping down; the 150-dMA of stocks advancing remains less than 50%; until they change, the long-term trend is still down. If that weren’t enough, the 50-dMA is lower than the 200-dMA indicating a “Death Cross” condition that has existed since mid-January.
WHY I DOUBT THE RALLY
…No capitulation at the bottom.
…Not enough fear.
…Market internals did not appreciably improve when compared to the prior low.
…TRIN was not elevated.
For more details see 16 Feb 2016 blog.
Speaking of fear, here’s a chart from Lance Roberts on the VIX vs S&P 500.
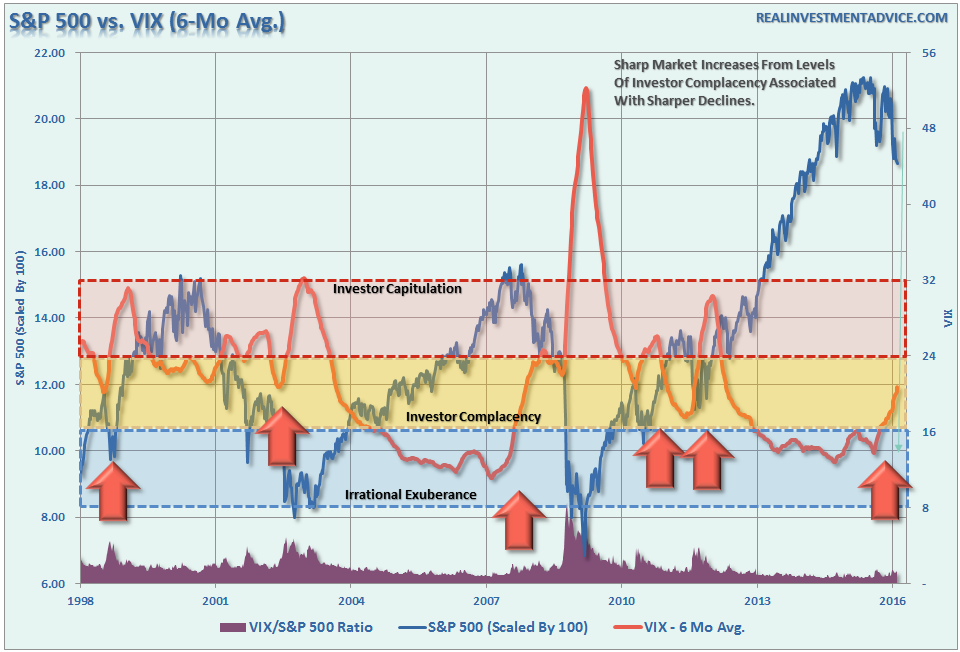
 Chart from Real Investment Advice at…
http://realinvestmentadvice.com/technically-speaking-gimme-a-rally/
MONEY TREND & SHORT TERM TRADING
The 10-dMA version of the Money Trend switched down Thursday suggesting a switch to a down trend, but the smoothed version remained up, so any signal is not particularly strong. I took a significant short position today – let’s see if I have the patience to stick with it if the market goes higher over the next several days. I expect a return to 1830, although it probably won’t be a straight line.
MARKET INTERNALS (NYSE DATA)
(I am getting data from various sites. Some of the numbers are subject to minor revision so the previous day’s numbers may be slightly different than reported yesterday.)
The 10-day moving average of the percentage of stocks advancing (NYSE) is 50.5% Thursday vs. 51.7% Wednesday. (A number above 50% is usually GOOD news for the markets. On a longer term, the 150-day moving average of advancing stocks remained 48.7%. A value below 50% indicates a down trend. The McClellan Oscillator (a Breadth measure) was essentially unchanged and remained positive on the day.
New-highs outpaced New-lows. The spread (new-highs minus new-lows) was +8 Thursday. (It was +5 Wednesday.) The 10-day moving average of the change in spread rose to +9. In other words, over the last 10-days, on average; the spread has INCREASED by 9 each day. Market Internals (based on 10-dMA) remained positive on the markets.

NTSM
Thursday, Price was positive; VIX, Volume and & Sentiment indicators were neutral. The long-term NTSM indicator is HOLD. (The first SELL signal of this cycle was 18 Dec 2015 and there has not been a BUY signal since.) There was a big improvement in long term indicators. If markets continue to improve, there could be a buy signal that would change my opinion on the markets in the next several days.

MY INVESTED STOCK POSITION:
TSP (RETIREMENT ACCOUNT – GOV EMPLOYEES) ALLOCATIONOn 30 Dec I reduced my invested position in my retirement account to 30% invested in stocks thru an S&P 500 Index fund (“C”-fund in the TSP). Friday, 15 Jan I reduced stock allocation to zero in long-term accounts. That leaves 100invested in cash yielding about 2%. Short-term bonds would be OK too.
The S&P 500 peaked in Mid-May and has not been able to break higher in the past 9-months. That looks like a top to me. See “Why the Bull Market May be Dead” in my 14 December blog at…
http://navigatethestockmarket.blogspot.com/2015/12/stocks-are-topping-time-to-sell-hussman.html
Even if that is true, there could still be a rally for 2 or 3-months.