“The number of open jobs was mostly unchanged in December
from the previous month, leaving openings at a healthy level. The Labor
Department said Tuesday job openings were flat at 5.5 million in December.”
Story at…
THE RAYMOND JAMES VIEW (Raymond James)
“I am sure somewhere in U.S. history there has been other
protests against presidents, but I can’t recall anything like what we are
seeing now. The acrimony is palpable and suggests the president is in trouble.
That statement brings back memories of a market axiom from my departed friend
Richard Russell (Dow Theory Letters) who used to write – when the president is
in trouble, the stock market is in trouble – something participants might want
to consider.” - Jeffery Saut, Chief
Investment Strategist. Commentary at…
My cmt: Mr. Saut also quoted some of Lowry Research’s
recent work in which they are bearish.
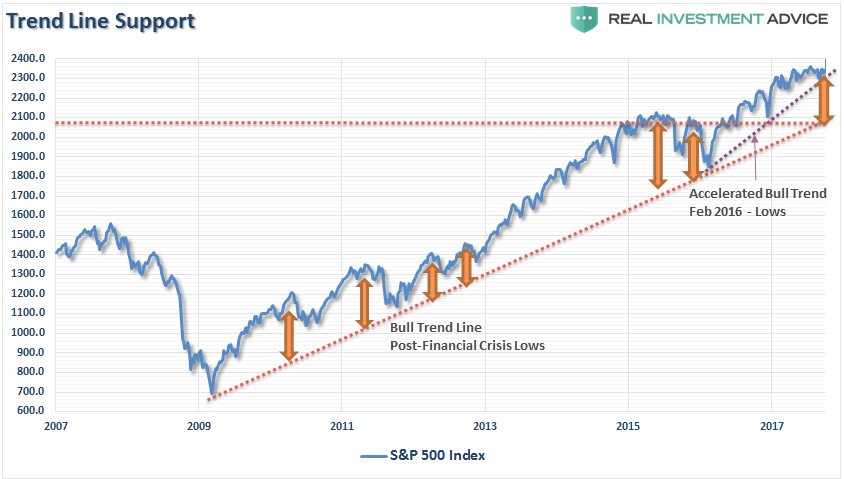
50% CORRECTION (Real Investment Advice)
See chart below: “A correction from 2400 back to
that bullish uptrend line, which occurred in both 2011 and 2012, would entail a
decline to 2100. That would be a 14.2% decline and while not
technically a “bear” market,
for many investors it will certainly “feel” like
one.” – Lance Roberts.
 Chart and Lance Roberts commentary at…
My cmt: Apparently, Lance Roberts took some heat on his
70% bear market warning last week. See the above link for a full discussion.
MARKET REPORT / ANALYSIS
-Tuesday the S&P 500 was unchanged at 2293. (The
action was bearish since the Index faded all day.)
-VIX dipped about 0.6% to 11.30.
-The yield on the 10-year Treasury slipped to 2.393%.
(Since the yield is an inverse to price, this means investors were buying
Treasuries.)
SENTIMENT. In addition to bearish issues noted in recent
blog posts, Sentiment has reached extreme levels. I measure Sentiment as
%-Bulls (Bulls/{bulls+bears}) based on the amounts invested in Rydex/Guggenheim
mutual funds. Sentiment reached 80%-Bulls for 4-days a month ago. On a standard deviation basis, that value
matched extremes seen during the dot.com crash. It also reached similar extreme
levels back in May-June 2015 after the Top that preceded a 12% correction. It
is currently at 81%-bulls (as of Monday’s close) and climbing as investors have
been buying-the-dip and that is a typical reaction – sentiment tends to peak
after a top. This isn’t by itself a great indicator since sentiment can remain
elevated for some time, but it’s another reminder that caution is
warranted.
Given the number of bearish indications noted recently …see
“Bear Signals” at
… we’re overdue for a correction. The Lance Roberts commentary linked above,
noted that a 14% correction would take the Index back to its long term trend
line. That seems about right. With the level of bullishness recently, it is
also possible that a simple retracement of about 5% may be the limit of damage
in the near term. I doubt that this is
the start of a 50-70% crash, but depending on the FED, it is a possibility this
year.
The Sum of 16-indicators went from +6 to -2. That’s a fairly bearish swing. Bollinger
Bands are giving a bearish signal. Money Trend was flat today and appears to be
rolling over to the downside.
Broken Record Report: As I’ve said for a while, I think
the upside potential is limited while the downside risk is fairly high, at
least for a short-term pullback. I remain a short-term bear; Long-term I am a
Bull.
CURRENT RANKING OF 11 ETFs (Ranked Daily)*
#1 RANK for the past 64-days: Financial Select Sector
SPDR ETF (XLF).
Here’s today’s complete result of the ETF Ranking.

I would avoid IBB and XLV; currently their 120-dMAs are
declining, but they have been improving recently.
*For background on the ETF ranking system see NTSM Page
at…
TRADING PORTFOLIO - 2017 (Small-% of the total portfolio)
Rydex 2x Short S&P 500 (RYTPX): Established 6 Dec.
2x Short S&P 500 (SDS): Established 16 Dec.
Long Volatility ETN (VXX): Established 6 Jan 2017.
NET:
Now I wish I had tightened trading rules sooner. I am
underwater again!
-“In a
bull market, you can only be long or neutral.” – D. Gartman
-“The best policy
is to avoid shorting unless a major bear market is underway and downside
momentum has been thoroughly established. Even then, your timing must sometimes
be perfect. In a bull market the trend is truly your friend, and trading
against the grain is usually a fool's errand.” – Clif Droke. Commentary
at…
TUESDAY MARKET INTERNALS (NYSE DATA)
-10-day moving average of the percentage of stocks
advancing (NYSE): 51.6%. (54.4% prior trading-day.) A number above 50% is
usually BULLISH for the markets short-term.
-150-day moving average of advancing stocks: 52.5%. (A
value above 50% indicates a long-term, up-trend.)
-McClellan Oscillator: Deteriorated from +5 to -18
(percentage calculation method adjusted to fit McClellan’s values).
-New-highs minus new-lows: +124
(It was +130 prior trading day.)
-10-day moving average of the change in spread: -7. In
other words, over the last 10-days, on average, the spread has decreased by 7
each day.
Market Internals
switched to Negative on the market.

Market Internals are a decent trend-following analysis of
current market action, but should not be used alone for short term trading.
They are usually right, but they are often late. They are most useful when they diverge from
the Index. In 2014, using these
internals alone would have made a 9% return vs. 13% for the S&P 500 (in on
Positive, out on Negative – no shorting).
LONG TERM INDICATOR
Tuesday, Sentiment was negative. VIX & Volume indicators were neutral. The
Price indicator was positive.

MY INVESTED STOCK POSITION:
TSP (RETIREMENT ACCOUNT – GOV EMPLOYEES) ALLOCATION
I increased stock allocation to 50% stocks in
the S&P 500 Index fund (C-Fund) Friday, 23 Sep 2016 in my long-term accounts. Remainder is 50% G-Fund.
This is a conservative retiree allocation.