“Employers added 148,000 workers, compared with the
190,000 median estimate of economists surveyed by Bloomberg, held back by a
drop in retail positions, a Labor Department report showed Friday. The jobless
rate was at 4.1 percent for a third month, while average hourly earnings
increased by 2.5 percent from a year earlier, after a 2.4 percent gain in
November that was revised downward.” Story at…
My cmt: The Unemployment rate is now 4.1%. A friend who
is an MBA told me that he was taught that 4% was as low as the
employment rate can go. In other words, we are very close to maximum employment.
FACTORY ORDERS (Morningstar)
“Sales at U.S factories rose steadily in November,
suggesting the strengthening U.S. and global economies are boosting demand for
American goods.
Factory orders, reflecting sales of everything from paper
to bulldozers, increased 1.3% in November from a month earlier…” Story at…
ISM SERVICES
“…the ISM gauge on the vast U.S. services sector
unexpectedly fell for a second straight month in December to 55.9 from 57.4 in
November… “You are still seeing growth,” Nieves [Anthony Nieves, chair of the
Institute for Supply Management’s non-manufacturing business survey committee] said
on a conference call with reporters after ISM released its non-manufacturing
activity data for December earlier.” Story at…
MARKET REPORT / ANALYSIS
-Friday the S&P 500 was up about 0.7% to 2743.
-VIX was unchanged at 9.22.
-The yield on the 10-year Treasury dipped slightly to 2.477%.
My sum of 17 Indicators improved from +5 to +6 today. On
a 10-day basis, values were flat. A “+” number means that most indicators are
bullish.
In the last 5-years, the S&P 500 has never
outperformed Utilities (XLU) as much as now. Utilities are a safe haven so this
is a sign of complacency in the markets. Conversely, XLI (Cyclical Industrials)
are outperforming the S&P 500, but not at an extreme. Cyclicals don’t do as
well vs the S&P 500 if investors are worried. Currently, no one is worried.
The extreme low VIX (below 10) is more evidence of complacency.
More topping indicators are negative today: Bollinger
Bands remain “overbought”, a sell signal for this indicator; RSI is overbought which
is now a sell signal and so is the Overbought-Oversold ratio. The S&P 500 is 10.2% above its 200-day
moving average and that is a sell signal too. Today was another statistically-significant
up-day suggesting a down day for tomorrow about 60% of the time. If this isn’t
a top, there will be one soon. It may be a short-term top or a bigger problem
we don’t know.
I am bearish short-term; longer term I am a bull, but I
recommend caution with the Fed raising rates and shrinking its balance sheet. In
addition, we are due for a correction in 2018 due to Presidential election
cycle history.
TODAY’S RANKING OF 15 ETFs (Ranked Daily)

The top ranked ETF receives 100%. The rest are then
ranked based on their momentum relative to the leading ETF. While momentum isn’t stock performance per
se, momentum is closely related to stock performance. For example, over the 4-months
from Oct thru mid-February 2016, the number 1 ranked Financials (XLF) outperformed
the S&P 500 by nearly 20%.
*For additional background on the ETF ranking system see
NTSM Page at…
Energy (XLE) was #1. The markets are due for some
reversion so perhaps I’ll get a better buying opportunity later. I’ll wait before adding any positions. (I
hold XLK, DVY and SPY. DVY is a dividend play. SPY is a good core holding.)
Under my system in 2017, Technology (XLK) was ranked in
the top 3 Momentum Plays for 52% of all trading days in 2017 (if I counted
correctly.) XLK was up 35% on the year. Its weighted Average PE is 23.7.
TODAY’S RANKING OF THE DOW 30 STOCKS (Ranked Daily)
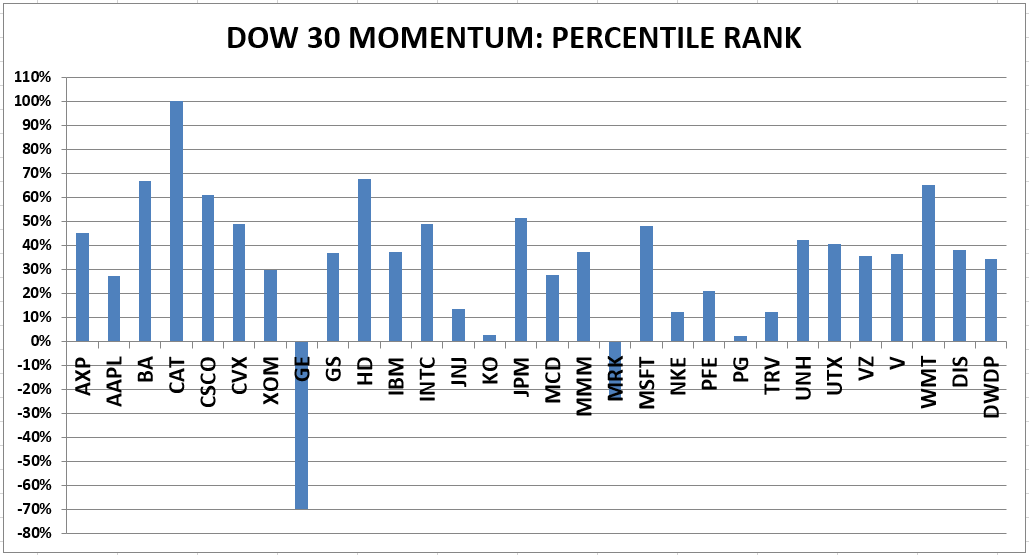
The top ranked stock receives 100%. The rest are then
ranked based on their momentum relative to the leading stock.
Caterpillar remained #1.
I hold Intel – I’m waiting for a better entry point
before adding other positions. Intel is now a value play so I am holding it.
Avoid GE and Merck. Their 120-day moving averages are
falling.
*I rank the Dow 30 similarly to the ETF ranking system.
For more details, see NTSM Page at…
FRIDAY MARKET INTERNALS (NYSE DATA)
Market Internals improved
to Positive on the market. (Market Internals are based on a package of
internals and all must be positive to create a positive indication.
Market Internals are a decent trend-following analysis of
current market action, but should not be used alone for short term trading.
They are usually right, but they are often late. They are most useful when they diverge from
the Index. In 2014, using these
internals alone would have made a 9% return vs. 13% for the S&P 500 (in on Positive,
out on Negative – no shorting).
LONG TERM INDICATOR
Friday, Price indicator was positive; Sentiment was negative; Volume
& VIX indicators were neutral.
With VIX recently below 10 for a couple of days each month from May thru
December 2017, and now January 2018, VIX may be prone to incorrect signals.
Usually, a rising VIX is a bad market sign; now it may move up, but that might
just signal normalization of VIX, i.e., VIX and the Index may both rise. As an
indicator, VIX is out of the picture for a while. VIX below 10 last occurred
about 4-months before the year 2007 crash and also several months before the
2001 crash. 6-months with VIX below 10 is unprecedented in the last 20-years.
MY INVESTED STOCK POSITION:
TSP (RETIREMENT ACCOUNT – GOV EMPLOYEES) ALLOCATION
I increased
stock allocation to 50% stocks in the S&P 500 Index fund (C-Fund) 24 March
2017 in my long-term accounts, based on short-term indicators. The remainder
is 50% G-Fund (Government securities). This is a conservative retiree
allocation, but I consider it fully invested for my situation.