CHICAGO BUSINESS BAROMETER / CHICAGO PMI (MNI-MarketNews)
“The Chicago Business Barometer (TM), produced with MNI,
rose 2.6 points in December, hitting a four-month high of 48.9. Business
sentiment dropped by 1.2 points to 46.2 in Q4, marking the lowest quarterly
reading since Q2 2009. The index was below the 50-mark for the second
successive quarter…An indicator reading above 50 shows expansion compared with
a month earlier while below 50 indicates contraction.” Press release at…
STOCK MARKET DATA SCREAMING OPPORTUNITY (Ciovacco
Capital)

YouTube Video at…
My cmt: As always, this is a detailed comprehensive
video. Bottom line: Today’s data is similar to the middle arrow. Assuming similarities
remain as we move ahead, and the analysis by Chris Ciovacco is correct, we have
a long way to go before a top. I see no flaws in his logic.
PAUL SCHATZ COMMENTARY EXCERPT (Heritage Capital)
“…make no mistake about the historic sentiment readings
we are currently seeing now. This is the polar opposite of what we saw one year
ago when the masses were screaming about a 2008 redux. Caution will be
warranted in Q1 of 2020.” Commentary at…
MARKET REPORT / ANALYSIS
-Monday the S&P 500 was dipped about 0.6% to 3221.
-VIX rose about 10% to 14.82.
-The yield on the 10-year Treasury rose to 1.883.
One of the indicators I follow is the Fosback High/Low
Logic Indicator. “The High Low Logic Index was developed by Norman Fosback. It
is calculated as the lesser of the number of new highs or new lows divided by
the total number of issues traded. Daily or weekly NYSE data is typically used
in the calculation of a moving average. The concept behind the indicator is that
either a large number of stocks will establish new highs or a large number of
stocks will establish new lows, but normally not both at the same time. Since
the High Low Logic Index is the lesser of the two ration, high readings are
infrequent. When a high indicator reading does occur, it signifies that market
internals are inconsistent with many stocks establishing new highs at the same
time that many stocks establish new lows. When this happens, it is considered
bearish for stock prices.” From…
The Fosback indicator is a better “sell” indicator than
“buy,” but now is nearly registering a BUY signal even after today’s down-day.
I interpret this to mean that while we are expecting a pullback (based on
Topping Indicators), it should be small, because we are currently seeing high
new-highs and low new-lows.
Volume picked up today (compared to last week), but it
was still about 15% below the monthly average.
There are now 2 topping-indicators calling a top. The top
indicators are: RSI was overbought; and the S&P 500 is too far above its
200-dMA when sentiment is considered.
My MACD of Breadth is close to sending a bearish
signal. The same is true for the MACD of
S&P 500 price.
My daily sum of 20 Indicators slipped from -1 t -5
(a positive number is bullish; negatives are bearish) while the 10-day smoothed
sum that negates the daily fluctuations declined from +26 to +16 (These
numbers sometimes change after I post the blog based on data that comes in
late.) A reminder: Most of these indicators are short-term. This isn’t a strong
signal since the number has been drifting around zero.
I remain bullish in the long-term; short-term - it looks
like we are in for a bit of a pullback. My guess is that the pullback will get
underway for real after the New Year rolls in – we’ll see.
Any pullback should be small: Breadth remains good; the
Fosback New-High/New-Low Logic Index is much closer to a buy than a sell and we
saw good breadth at the recent Top.
TOP / BOTTOM INDICATOR SCALE OF 1 TO 10 (Zero is a
neutral reading.)
Today’s Reading: -2
Most Recent Day with a value other than Zero: -2 on 27
December (RSI was overbought; and the S&P 500 is too far above its 200-dMA
when sentiment is considered).
(1) +10 Max Bullish / -10 Max Bearish)
(2) -4 or below is a Sell sign. +4 or higher is a Buy
Sign.
MOMENTUM ANALYSIS:
TODAY’S RANKING OF
15 ETFs (Ranked Daily)

The top ranked ETF receives 100%. The rest are then
ranked based on their momentum relative to the leading ETF. While momentum isn’t stock performance per
se, momentum is closely related to stock performance. For example, over the
4-months from Oct thru mid-February 2016, the number 1 ranked Financials (XLF)
outperformed the S&P 500 by nearly 20%. In 2017 Technology (XLK) was ranked
in the top 3 Momentum Plays for 52% of all trading days in 2017 (if I counted
correctly.) XLK was up 35% on the year while the S&P 500 was up 18%.
*For additional background on the ETF ranking system see
NTSM Page at…
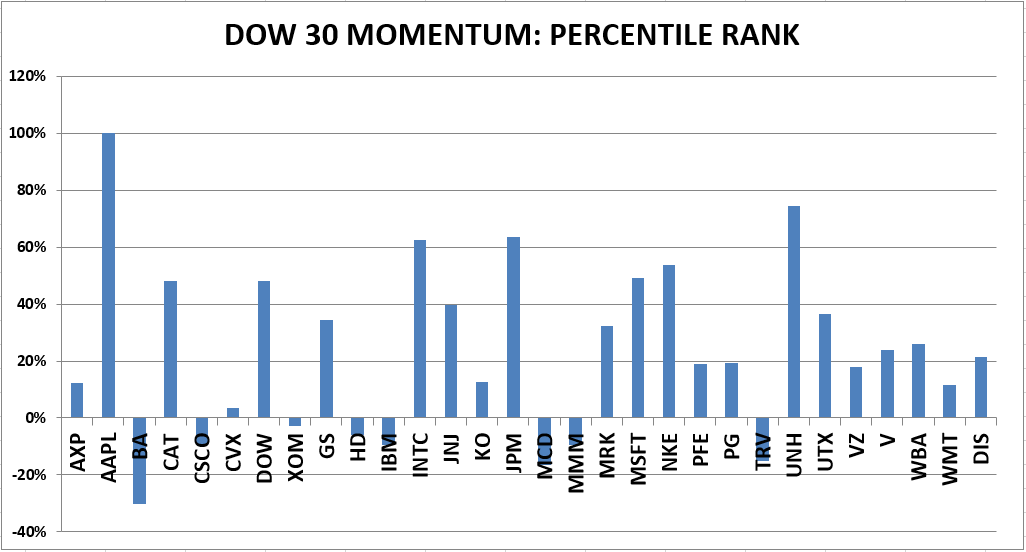
TODAY’S RANKING OF THE DOW 30 STOCKS (Ranked Daily)
The top ranked stock receives 100%. The rest are then
ranked based on their momentum relative to the leading stock.
AAPL remains #1 and it was the only stock in the DOW that was up today.
MONDAY MARKET INTERNALS (NYSE DATA)
Market Internals remained
NEUTRAL on the market, but we saw significant deterioration.
Market Internals are a decent trend-following analysis of
current market action but should not be used alone for short term trading. They
are usually right, but they are often late.
They are most useful when they diverge from the Index. In 2014, using these internals alone would
have made a 9% return vs. 13% for the S&P 500 (in on Positive, out on
Negative – no shorting).
Using the Short-term indicator in 2018 in SPY would have
made a 5% gain instead of a 6% loss for buy-and-hold. The methodology was Buy
on a POSITIVE indication and Sell on a NEGATIVE indication and stay out until
the next POSITIVE indication. The back-test included 13-buys and 13-sells, or a
trade every 2-weeks on average.
My current stock allocation is about 60% invested in
stocks as of 7 Oct 2019 (up from 50%). This is a conservative balanced position
appropriate for a retiree. You may wish to have a higher or lower % invested in
stocks depending on your risk tolerance.
INTERMEDIATE / LONG-TERM INDICATOR
Monday, the PRICE indicator was Bullish; VIX,
VOLUME and SENTIMENT Indicators were neutral. Overall, the Long-Term Indicator
slipped to HOLD. At present, I expect a small pullback so we are looking
for a better buying opportunity.