LARGEST CUTS OF S&P 500 EPS ESTIMATES IN 4 YEARS –
EXCERPT (FactSet)
“…the
bottom-up EPS [Earnings per Share] estimate for the first half of 2019 (1H
2019) decreased by 4.5% (to $81.73 from $85.56) over the past three
months...the 4.5% decline marked the largest decrease since 1H 2015 (-6.6%) and
the fourth largest decrease since 1H 2004…”
my cmt: There was a 5.2% EPS decline in 1H2008 and a
24.1% decline in 1H2009, the crash years. The current data doesn’t mean there
is a crash coming, but earnings are going the wrong way while the FED is
tightening rather than loosening. It does not pay to be complacent now. A crash
is possible, but likely a less than 50% probability.
ANOTHER #FEDFAKE
I used to think the trader talk about Government “Plunge
Protection Teams” propping up the markets couldn’t be true; but as shown in the
following chart, when the dips have occurred, world-wide Central Bank Balance
sheets have dramatically increased. With the FED now trying to cut its balance
sheet, one wonders whether the US markets can get back to the prior highs. As
Jesse Columbo of real Investment Advice noted last week, “If the “market” heads
higher from here, that just means more rate hikes are back on the table.” See
“Another #FedFake” at…

UNDER PRICING RISK (Real Investment Advice)
“Excessive pessimism and poor price action contributed to
a Christmas Eve low which provided an opportunity to go long. Excessive
optimism and good price action is now contributing to a late January high which
might be providing an opportunity to sell stocks. Sorry, Ethel, everything
is not coming
up roses.” – Lance Roberts. Commentary at…
MARKET REPORT / ANALYSIS
-Wednesday the S&P 500 was up about 0.2% to 2639.
-VIX dropped about 6% to 19.52.
-The yield on the 10-year Treasury was little changed at
2.742%.
We noted that Friday was probably a short-term top, based on
the evidence. We haven’t seen anything to change that view.
My Money Trend indicator is still headed down and that’s
a bearish sign. (This indicator attempts to follow the general concept of Lowry
Research and their supply and demand methodology for stock market analysis.
Their concept is based on a detailed stock-by-stock analysis while mine is an
estimate based on readily available Macro data.
Theirs is much more accurate, but that doesn’t mean mine isn’t useful.)
My daily sum of 17 Indicators was unchanged at +1 (a
positive number is bullish; negatives are bearish) while the 10-day smoothed
version that negates the daily fluctuations declined from +77 to +70. I tend to
watch the direction of this indicator and for now it is headed down, a bearish
sign.
Repeating what I’ve been saying for a while:
A “V”-bottom is very unusual and I don’t think it is
likely that this correction will race to a top without a retest of the prior
low at 2351. I sold the rally and cut my stock holdings back to about 30%, 9
January to reduce risk. Only a retest at the 2351 level, or a climb back above
the old highs (not likely without a retest), will tell us whether 2351 was THE
bottom.
MOMENTUM ANALYSIS:
(Momentum analysis is suspect in a selloff, so I‘d be
careful using momentum data for the time being – the only reason utilities are
highly ranked among ETFs is as an alternative to stocks during the correction.) The same is true for individual stocks in the
Dow 30.
TODAY’S RANKING OF
15 ETFs (Ranked Daily)
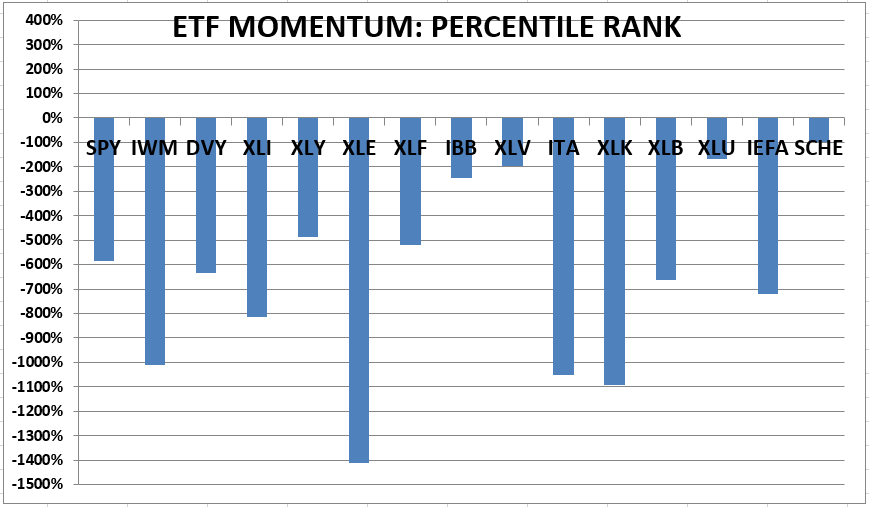
The top ranked ETF receives 100%. (In this case -100%
since all are negative.) The rest are then ranked based on their momentum
relative to the leading ETF. While
momentum isn’t stock performance per se, momentum is closely related to stock
performance. For example, over the 4-months from Oct thru mid-February 2016,
the number 1 ranked Financials (XLF) outperformed the S&P 500 by nearly
20%. In 2017 Technology (XLK) was ranked in the top 3 Momentum Plays for 52% of
all trading days in 2017 (if I counted correctly.) XLK was up 35% on the year
while the S&P 500 was up 18%.
*For additional background on the ETF ranking system see
NTSM Page at…
TODAY’S RANKING OF THE DOW 30 STOCKS (Ranked Daily)

The top ranked stock receives 100%. The rest are then
ranked based on their momentum relative to the leading stock.
*I rank the Dow 30 similarly to the ETF ranking system.
For more details, see NTSM Page at…
WEDNESDAY MARKET INTERNALS (NYSE DATA)
Market Internals remained
NEUTRAL on the market.
My current stock allocation is about 30% invested in
stocks on as of 9 January 2019. For me, fully invested is a balanced 50% stock
portfolio so this is a very conservative position.
INTERMEDIATE / LONG-TERM INDICATOR
Wednesday, the
Sentiment and Price indicators were positive; The Volume and VIX indicators
were neutral. Overall this is a NEUTRAL indication. The longer/intermediate-term
version of Sentiment is neutral.