CRUDE INVENTORIES (OilPrice.com)
“The Energy Information Administration reported a
crude oil inventory build of 3.7 million barrels for the week to February 15,
versus an increase of 3.6 million barrels in
the previous week, pushing prices lower.” Story at…
FED WILL ADJUST QT IF NEEDED (CNBC)
“Fed Vice Chair Randal Quarles said at a conference that
the central bank remains committed to its dual mandate of full employment and
keeping inflation at a healthy level. "The normalization of the balance
sheet is not a competing goal," he said at the Chicago Booth U.S. Monetary
Policy Forum in New York. "If ever it appears that our plans for the
balance sheet are running counter to the achievement of our dual-mandate
objectives, we would quickly reassess our approach to the balance sheet."
The Fed currently is in the process of reducing the level of bonds it is
holding on the
balance sheet.” Story at…
My cmt: In other words, the FED will continue to prop up
markets.
MARKET REPORT / ANALYSIS
-Friday the S&P 500 rose about 0.6% to 2793.
-VIX dropped about 7% to 13.51.
-The yield on the 10-year Treasury slipped to 2.655%.
As one might expect, today’s big move higher, along with
its strong market internals, flipped a number of my indicators to the bullish
side.
The Index is now 1.6% above the 200-dMA.
My daily sum of 18 Indicators improved from +8 to +11 (a
positive number is bullish; negatives are bearish) while the 10-day smoothed
version that negates the daily fluctuations rose a bit from +71 to +72.
Overall, this indicator is now somewhat bullish since the longer-term value is neutral/rising
and the daily value is well to the bullish side.
Again, late-day action was up today, however, the smoothed
version of late-day action continues down. It suggests the Pros are beginning
to doubt the rally, but you wouldn’t know it based on today’s bullish move late
in the day. The willingness of traders to hold the Index over the weekend
indicates optimism.
With the FED once again placating the markets, perhaps
the markets will go up forever? The move has been straight up for
2-months. That’s longer than normal
after a correction end (usually after a retest), but these big moves do end and
retracement follows. In 2011 after the 19% correction, the S&P 500 jumped
17% higher without a break after the final bottom. When the market stalled, it
dropped 10%. So, to answer the rhetorical question, markets don’t go up forever
and we’ll probably see a healthy retracement depending on how far the Index
advances.
I’m reluctant to jump back in when markets are getting over-bought
based on Price and Breadth. I hope to identify a better entry point to get back
in the market.
A full retest of the Christmas Eve low seems unlikely
now, but it could still happen. Only a retest at the 2351 level, or a climb back
above the old highs, will tell us whether 2351 was THE bottom. Yesterday’s
financial data (LEI, Philly FED, Durable Orders and Jobless Claims) were weak
and one wonders whether the markets can retake old highs any time soon – it
looks doubtful to me.
MOMENTUM ANALYSIS:
TODAY’S RANKING OF
15 ETFs (Ranked Daily)
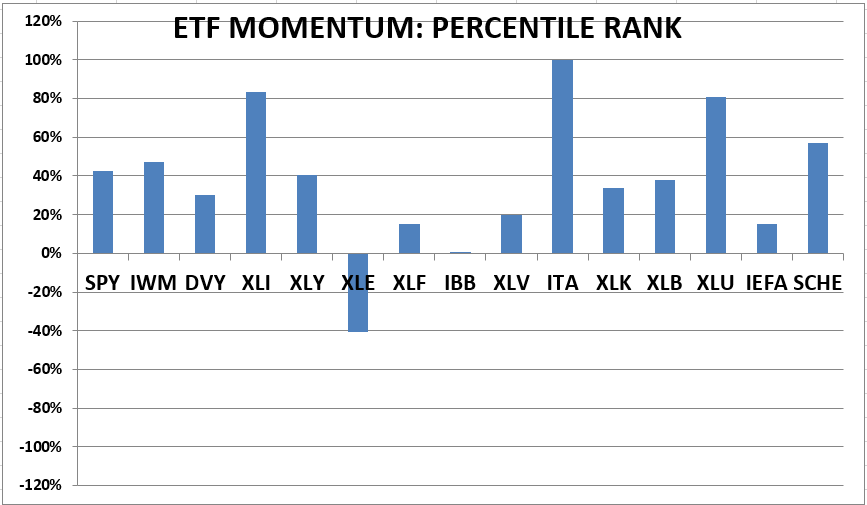
The top ranked ETF receives 100%. The rest are then
ranked based on their momentum relative to the leading ETF. While momentum isn’t stock performance per
se, momentum is closely related to stock performance. For example, over the
4-months from Oct thru mid-February 2016, the number 1 ranked Financials (XLF)
outperformed the S&P 500 by nearly 20%. In 2017 Technology (XLK) was ranked
in the top 3 Momentum Plays for 52% of all trading days in 2017 (if I counted
correctly.) XLK was up 35% on the year while the S&P 500 was up 18%.
*For additional background on the ETF ranking system see
NTSM Page at…
TODAY’S RANKING OF THE DOW 30 STOCKS (Ranked Daily)

The top ranked stock receives 100%. The rest are then
ranked based on their momentum relative to the leading stock.
*I rank the Dow 30 similarly to the ETF ranking system.
For more details, see NTSM Page at…
FRIDAY MARKET INTERNALS (NYSE DATA)
Market Internals switched
to Positive on the market.
Market Internals are a decent trend-following analysis of
current market action but should not be used alone for short term trading. They
are usually right, but they are often late.
They are most useful when they diverge from the Index. In 2014, using these internals alone would
have made a 9% return vs. 13% for the S&P 500 (in on Positive, out on
Negative – no shorting).
My current stock allocation is about 30% invested in
stocks on as of 9 January 2019. For me, fully invested is a balanced 50% stock
portfolio so this is a very conservative position.
INTERMEDIATE / LONG-TERM INDICATOR
Friday, the VIX,
VOLUME and PRICE indicators were positive. The SENTIMENT indicator was neutral.
Overall this is a POSITIVE/BULLISH indication. I remain defensive, expecting
some sort of pullback.