EMPIRE STATE MANUFACTURING (MarketWatch)
“The New York Fed’s Empire State business-conditions
index showed slight improvement in October, according to a report posted about
18 hours ahead of schedule…The report released Monday shows that a rebound in
sentiment pushed the headline Empire State index up to 4 in October from 2 in
the prior month. Economists has been expecting a 0.8 reading…” Story at…
FOLLOW-THROUGH DAY (askinvestorhelp.com)
“From the beginning of any attempted market rally during
a definite downtrend, a 'follow-through' day is identified when a major index
closes significantly higher, over 1% for the day, on a strong increase in
volume from the day before. The first two or three days of a rally are normally
disregarded, as the rally has not yet proven it will succeed and 'follow
through' with power and conviction. 'Follow-through' days therefore generally
occur the fourth through seventh day of the attempted rally. They serve as a
confirmation that the market has really changed direction and is in a new
uptrend.
MARKET REPORT / ANALYSIS
Tuesday the S&P 500 rose about 1.0% to 2996.
-VIX fell about 7% to 13.54.
-The yield on the 10-year Treasury rose to 1.774.
At the 8 October low, we identified it as the likely low
and suggested we had a buy. I wrote, “…it still looks like we got confirmation
of the low. There were a number of bottom signs…” Additional confirmation
sometimes comes from a follow-through day. (See above definition.) Today was a follow-through
day, 5 days after the bottom. As noted in the definition, they usually occur 4
to 7 days after a bottom. This one wasn’t as strong as I’d like, but we’ll take
it.
My daily sum of 20 Indicators improved from -1 to +4
(a positive number is bullish; negatives are bearish) while the 10-day smoothed
version that negates the daily fluctuations rose from -58 to -49. (These
numbers sometimes change after I post the blog based on data that comes in
late.) A reminder: Most of these indicators are short-term.
Today, even more indicators turned bullish. MACD of
S&P 500 price gave a buy signal. Money Trend is positive and the
new-high/new-low data looks good. The
Market Internals short-term indicator turned bullish and the 5-10-20 Timer gave
a buy signal.
I remain bullish.
TOP / BOTTOM INDICATOR SCALE OF 1 TO 10 (Zero is a
neutral reading.)
Today’s Reading: 0
Most Recent Day with a value other than Zero: +2 on 3
October.
(1) +10 Max Bullish / -10 Max Bearish)
(2) -4 or below is a Sell sign. +4 or better is a Buy
Sign.
MOMENTUM ANALYSIS:
TODAY’S RANKING OF
15 ETFs (Ranked Daily)
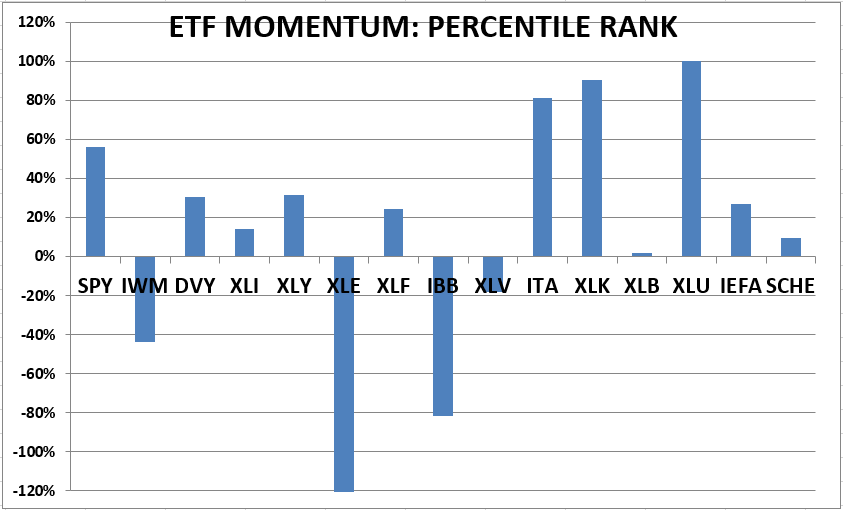
The top ranked ETF receives 100%. The rest are then
ranked based on their momentum relative to the leading ETF. While momentum isn’t stock performance per
se, momentum is closely related to stock performance. For example, over the
4-months from Oct thru mid-February 2016, the number 1 ranked Financials (XLF)
outperformed the S&P 500 by nearly 20%. In 2017 Technology (XLK) was ranked
in the top 3 Momentum Plays for 52% of all trading days in 2017 (if I counted
correctly.) XLK was up 35% on the year while the S&P 500 was up 18%.
*For additional background on the ETF ranking system see
NTSM Page at…
TODAY’S RANKING OF THE DOW 30 STOCKS (Ranked Daily)

The top ranked stock receives 100%. The rest are then
ranked based on their momentum relative to the leading stock.
*I rank the Dow 30 similarly to the ETF ranking system.
For more details, see NTSM Page at…
TUESDAY MARKET INTERNALS (NYSE DATA)
Market Internals
improved to POSITIVE on the market.
Market Internals are a decent trend-following analysis of
current market action but should not be used alone for short term trading. They
are usually right, but they are often late.
They are most useful when they diverge from the Index. In 2014, using these internals alone would
have made a 9% return vs. 13% for the S&P 500 (in on Positive, out on
Negative – no shorting).
Using the Short-term indicator in 2018 in SPY would have
made a 5% gain instead of a 6% loss for buy-and-hold. The methodology was Buy
on a POSITIVE indication and Sell on a NEGATIVE indication and stay out until
the next POSITIVE indication. The back-test included 13-buys and 13-sells, or a
trade every 2-weeks on average.
My current stock allocation is about 60% invested in
stocks as of 7 Oct 2019 (up from 50%). This is a conservative balanced position
appropriate for a retiree.
INTERMEDIATE / LONG-TERM INDICATOR
Tuesday, the VIX, VOLUME, PRICE and
SENTIMENT Indicators were neutral. Overall, the Long-Term Indicator remained
HOLD.