“Trade what you see; not what you think.” – The Old Fool,
Richard McCranie, trader extraordinaire.
“The big money is not in the buying and selling. But in
the waiting.” - Charlie Munger, Vice Chairman, Berkshire Hathaway
“Bubbles tend to topple under their own weight. Everybody
is in. The last short has covered. The last buyer has bought (or bought massive
amounts of weekly calls). The decline starts and the psychology shifts from
greed to complacency to worry to panic. Our working hypothesis, which might be
disproven, is that September 2, 2020 was the top and the bubble has already
popped.” - David Einhorn, Greenlight hedge fund.

EMPIRE STATE MANUFACTURING (fxStreet)
“The headline General Business Conditions Index of the NY
Fed's Empire State Manufacturing Survey fell to 6.3 in November from 10.5
in October, the NY Fed's report revealed on Monday. This reading missed
analysts' estimate of 13.5 by a wide margin.” Story at...
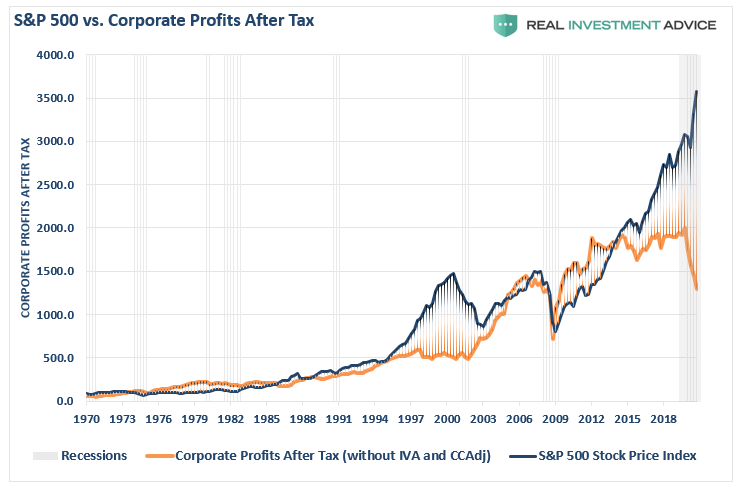
BUFFET INDICAT0R – WHY INVESTORS ARE WALKING INTO A TRAP [Excerpt]
(Real Investment Advice)

“When it comes to the state of the market, corporate
profits are the best indicator of economic strength. The detachment of the
stock market from underlying profitability guarantees poor future outcomes for
investors. But, as has always been the case, the markets can certainly
seem to ‘remain irrational longer than logic would predict’...While
investors cling to the “hope” that the Fed has everything under
control, there is more than a reasonable chance they don’t.” Charts and Commentary
at...
https://realinvestmentadvice.com/buffett-indicator-why-investors-are-walking-into-a-trap/
CORONAVIRUS (NTSM)
Here’s the latest from the COVID19 Johns Hopkins website at
9:30 pm Monday. US total case numbers are on the left axis; daily numbers are
on the right side of the graph with the 10-dMA of daily numbers in Green.

MARKET REPORT / ANALYSIS
-Monday the S&P 500 rose
about 1.2% to 3627.
-VIX fell about 3% to 22.45.
-The yield on the 10-year
Treasury rose to 0.904%.
The PE is near all-time highs,
more indicative of a top than a bottom.
Further, the 34% COVID drop was big enough to wash out weak hands, but
the timing (23-days top to bottom) was way too short. Bull markets die in
euphoria, not panic over a pandemic. That doesn’t mean we are going to see a
50% crash soon, but one is possible (I’d guess probable), now or in the next couple
of years.
Friday, we noted that the
S&P 500 is 14.2% above its 200-dMA and only 2% of issues on the NYSE made
new-highs at the 13 November all-time high. Looking back 11 years, the only
time I could find that those two indicators were bearish at the same time was
on 2 sept 2020. That was the top of the recently completed 9.6% correction.
I also found only 1
all-time-high with a lower % of new-highs over that 11-year period. That occurred
after a correction-low when new-highs would have been depressed. The bottom
line is that the markets are showing an extremely narrow advance suggesting a
fragile market ready to fall.
Today, Monday, the S&P 500
was 15.4% above its 200-dMA. It was 15.9% above at the 2 Sept top (10% corr.);
it was 11.5% above at the 19 Feb COVID-crash top (34% corr.); it was 14% above
at the 26 Jan 18 top (12% corr.). It’s hard to find numbers higher than 15.4%
in the last 10-years.
The % of NYSE Issues making
new-highs improved today, but the cat is out of the bag. We still have Friday’s
negative warning.
I’m not going to bother with an
indicator count. They are incredibly
bullish. Today, VIX joined the party and gave a Buy signal. The Long Term NTSM indicator
ensemble switched to BUY, 9 Nov. Now, Price, VIX and Volume are bullish;
Sentiment indicator is neutral. The ensemble remains BUY.
At this point, I see only one
indicator that counts:
The extreme overbought market pretty
much guarantees that we’ll have a pullback. I think it will begin sooner rather
than later. I’ll continue to sit out.
MOMENTUM ANALYSIS:
TODAY’S RANKING OF 15 ETFs (Ranked Daily)
The top ranked ETF receives
100%. The rest are then ranked based on their momentum relative to the leading
ETF.

*For additional background on
the ETF ranking system see NTSM Page at…
http://navigatethestockmarket.blogspot.com/p/exchange-traded-funds-etf-ranking.html
TODAY’S RANKING OF THE DOW 30
STOCKS (Ranked Daily)
Here’s the revised DOW 30 and
its momentum analysis. The top ranked stock receives 100%. The rest are then
ranked based on their momentum relative to the leading stock.

For more details, see NTSM
Page at…
https://navigatethestockmarket.blogspot.com/p/a-system-for-trading-dow-30-stocks-my_8.html
MONDAY MARKET INTERNALS (NYSE
DATA)
Market Internals remained POSITIVE.
Market Internals are a decent
trend-following analysis of current market action, but should not be used alone
for short term trading. They are usually right, but they are often late. They are most useful when they diverge from
the Index.

Using the Short-term indicator
in 2018 in SPY would have made a 5% gain instead of a 6% loss for buy-and-hold.
The methodology was Buy on a POSITIVE indication and Sell on a NEGATIVE
indication and stay out until the next POSITIVE indication. The back-test
included 13-buys and 13-sells, or a trade every 2-weeks on average.

My current stock allocation is
about 30% invested in stocks. You may wish to have a higher or lower % invested
in stocks depending on your risk tolerance. 30% is a very conservative position
that I re-evaluate daily, but it is appropriate for the correction.
As a retiree, 50% in the stock
market is about fully invested for me – it is a cautious and conservative
number. If I feel very confident, I might go to 60%; if this correction is deep
enough, 80% would not be out of the question.