“Trade what you see; not what you think.” – The Old Fool,
Richard McCranie, trader extraordinaire.
“The big money is not in the buying and selling. But in
the waiting.” - Charlie Munger, Vice Chairman, Berkshire Hathaway
“Bubbles tend to topple under their own weight. Everybody
is in. The last short has covered. The last buyer has bought (or bought massive
amounts of weekly calls). The decline starts and the psychology shifts from
greed to complacency to worry to panic. Our working hypothesis, which might be
disproven, is that September 2, 2020 was the top and the bubble has already
popped.” - David Einhorn, Greenlight hedge fund.
ISM MANUFACTURING (ISM via Prnewswire.com)
“New Orders and Production Growing; Employment
Contracting; Supplier Deliveries Slowing at Faster Rate; Backlog Growing; Raw
Materials Inventories Growing; Customers' Inventories Too Low; Prices
Increasing; Exports and Imports Growing.
Economic activity in the manufacturing sector grew
in November, with the overall economy notching a seventh
consecutive month of growth, say the nation's supply executives in the
latest Manufacturing ISM® Report On Business®...”
CONSTRUCTION SPENDING (AP / KRQE News)
“U.S. construction spending jumped 1.3% in October, again
on the strength of single-family home building.” Story at...
https://www.krqe.com/news/business/us-construction-spending-jumps-1-3-in-october/
RECOVERY “EXTRAORDINARILY UNCERTAIN (CNN)
“Federal Reserve Chairman Jerome Powell said the outlook
for the United States economy is "extraordinarily uncertain" as the
rise in Covid-19 cases continues to take an economic toll on the country. "As
we have emphasized throughout the pandemic, the outlook for the economy is
extraordinarily uncertain and will depend, in large part, on the success of
efforts to keep the virus in check." Powell said in prepared remarks for his testimony on Tuesday to
the US Senate Committee on Banking, Housing, and Urban Affairs.” Story at...
https://www.cnn.com/2020/11/30/investing/fed-jerome-powell-economy-coronavirus/index.html
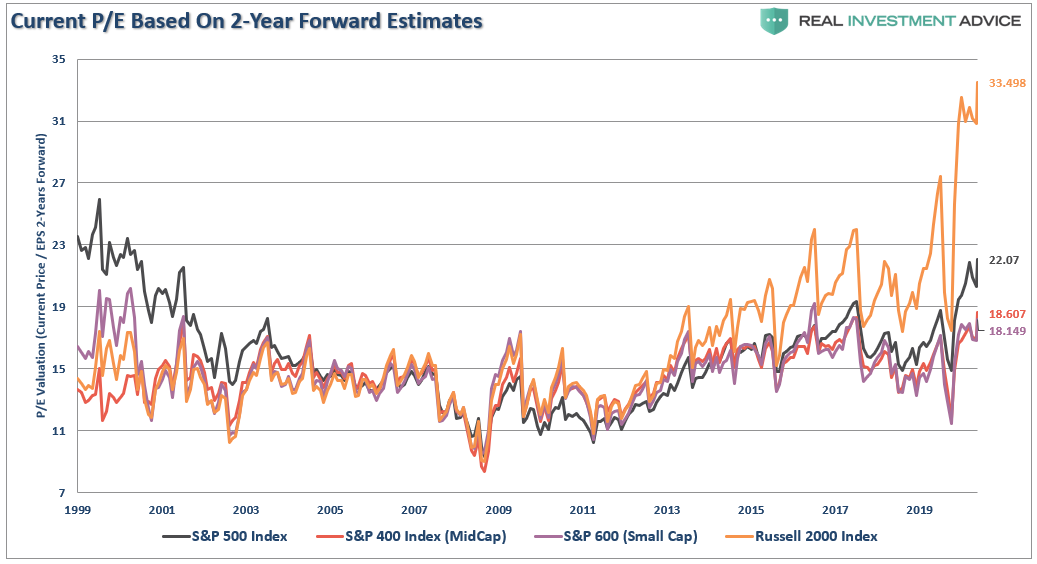
WIDOW MAKER TRADE (Real Investment Advice)
“...investors are again chasing “growth at any
price” and rationalizing overpaying for growth. As I discussed in the “Death Of Fundamentals:” Such makes the mantra of using
24-month estimates to justify paying exceedingly high valuations today, even
riskier...as a “fundamental” and “value” based
investor, the lack of performance in value versus growth has undoubtedly been
frustrating. However, one of the biggest problems is the astonishing lack of
value in “value.”

Chart updated as of November 2020
Commentary and charts at...
https://realinvestmentadvice.com/a-vaccine-wont-cure-the-20-year-widow-maker-trade/
CORONAVIRUS (NTSM)
Here’s the latest from the COVID19 Johns Hopkins website at
7:15 pm Tuesday. US total case numbers are on the left axis; daily numbers are
on the right side of the graph with the 10-dMA of daily numbers in Green. (I
averaged cases over the Holiday.)

MARKET REPORT / ANALYSIS
-Tuesday the S&P 500 rose
about 1.1% to 3662.
-VIX rose about 1% to 20.77.
-The yield on the 10-year
Treasury was 0.920%.
The S&P 500 made another
new-high today. Checking the data, we find that only 2.8% of stocks made new 52-week
highs at today’s all-time high. Again, that’s a weak number indicating a narrow
advance. We’ve had a couple of good
readings for this stat recently, but it’s best to evaluate each case as it
comes. This number suggests a correction of greater than 10%.
It appears that a number of
indicators are close to rolling over. Given the strong move higher today, that’s
a bit of a surprise. The % of stocks advancing over the last 10-days is
falling; up-volume is falling too, even as the market climbs higher.
I think we still need to see
Bollinger Bands and RSI turn overbought – that will be the top. I may still
have to remain patient as the markets crawl higher. I don’t think the top is in.
The daily sum of 20 Indicators
remained +6 (a positive number is bullish; negatives are bearish). The 10-day
smoothed sum that smooths the daily fluctuations dropped from +82 to +74.
(These numbers sometimes change after I post the blog based on data that comes
in late.) Most of these indicators are short-term and many are trend following.
The Long Term NTSM indicator
ensemble switched back up to BUY, 24 Nov. Now, Price, & VIX are bullish;
Sentiment & Volume are neutral. The Indicator remains BUY, but I think we
are near a top so I am waiting.
I continue to see very bullish
indicators. The problem is that the market remains extremely overbought with
the S&P 500 16.1% above its 200-dMA. If past history follows, that tends to
cap the gains going forward.
I’ll continue to keep a low %
of funds in the stock market until I see a better buying point.
MOMENTUM ANALYSIS:
TODAY’S RANKING OF 15 ETFs (Ranked Daily)
The top ranked ETF receives
100%. The rest are then ranked based on their momentum relative to the leading
ETF.

*For additional background on
the ETF ranking system see NTSM Page at…
http://navigatethestockmarket.blogspot.com/p/exchange-traded-funds-etf-ranking.html
TODAY’S RANKING OF THE DOW 30
STOCKS (Ranked Daily)
Here’s the revised DOW 30 and
its momentum analysis. The top ranked stock receives 100%. The rest are then
ranked based on their momentum relative to the leading stock.

For more details, see NTSM
Page at…
https://navigatethestockmarket.blogspot.com/p/a-system-for-trading-dow-30-stocks-my_8.html
TUESDAY MARKET INTERNALS (NYSE
DATA)
Market Internals remained NEUTRAL on the market.
Market Internals are a decent trend-following
analysis of current market action, but should not be used alone for short term
trading. They are usually right, but they are often late. They are most useful when they diverge from
the Index.

Using the Short-term indicator
in 2018 in SPY would have made a 5% gain instead of a 6% loss for buy-and-hold.
The methodology was Buy on a POSITIVE indication and Sell on a NEGATIVE
indication and stay out until the next POSITIVE indication. The back-test
included 13-buys and 13-sells, or a trade every 2-weeks on average.

My current stock allocation is
about 30% invested in stocks. You may wish to have a higher or lower % invested
in stocks depending on your risk tolerance. 30% is a very conservative position
that I re-evaluate daily.
The markets have not
retested the lows on recent corrections and that has left me under-invested on
the bounces. I need to put less reliance on retests in the future.
As a retiree, 50% in the stock
market is about fully invested for me – it is a cautious and conservative
number. If I feel very confident, I might go to 60%; if a correction is deep
enough, 80% would not be out of the question.