“Trade what you see; not what you think.” – The Old Fool,
Richard McCranie, trader extraordinaire.
“If I run and if I win, we will treat those people from
January 6 fairly. We will treat them fairly. And if it requires pardons, we
will give them pardons because they are being treated so unfairly.” – Donald Trump.
My cmt: “Pardons for those who attempted
to alter the election outcome through intimidation? I voted for Trump, but that
SOB belongs in prison.
“I don’t want to send any signals that it was OK to
defile the Capitol. I want to deter what people did on January 6, and those who
did it, I hope they go to jail and get the book thrown at them because they
deserve it.” – Lindsey Graham, Republican Senator from SC.
CHICAGO PMI (ShareCast)
“The MNI Chicago business barometer rose to 65.2
from a revised 64.3 in December, coming in ahead of expectations for a reading
61.7.” Story at...
CORONAVIRUS (NTSM)
Here’s the latest from the COVID19 Johns Hopkins website as
of 7:00 PM ET Monday. U.S. total case numbers are on the left axis; daily
numbers are on the right side of the graph in Red with the 10-dMA of daily
numbers in Green. I added the smoothed 10-dMA of new cases (in purple) to the
chart.
Remember Sweden? They didn’t lock-down and were convinced
that herd-immunity would be the best solution to the Coronavirus, Covid 19.
Their death rate is 1.5/100,000. The US
death rate is 70% higher at 2.6/100,000. I suspect they are a healthier people
without the obesity rate that we see in the US. Still, their strategy has not
proved to be the disaster that was predicted by the pundits and the media.
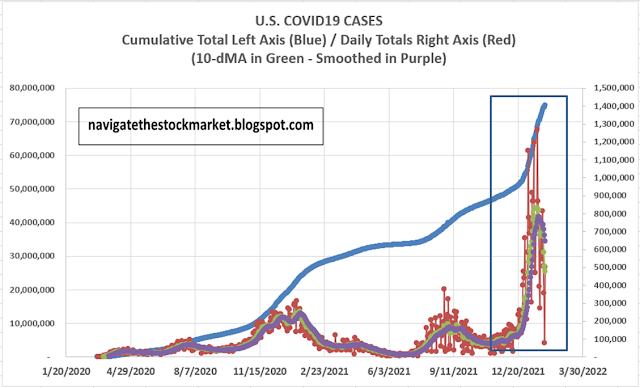
If we focus on the box in the above chart we can see (below) that the 10-dMA of new-cases and the smoothed 10-day has peaked.

MARKET REPORT / ANALYSIS
-Monday the S&P 500 jumped
about 1.9% to 4516.
-VIX dipped about 10% to 27.66. (That’s a 19% drop in 2
days.)
-The yield on the 10-year Treasury rose to 1.790%.
Given that most corrections retest the prior lows, I’ll
keep the pullback stats for a while.
Pullback Data:
Days since top: 19 (Avg= 30 days for corrections <10%;
60 days for larger, non-crash pullbacks)
Drop from Top: Now 5.9%; Max intraday: 12% (Avg.= 13% for
non-crash pullbacks)
The S&P 500 is 1.8% above its 200-dMA.
The slope of the 200-dMA is still up.
I think the bottom was Thursday. My signal to buy was Tuesday, 27 January when
we saw sharply improved internals on lower-volume at the lower-low. After that New-lows jumped higher worrying
investors. That improved this morning
and the close was much better. There was a 3.5 std-deviation improvement in new-high/new-low data and that is
a signal that the correction is over, or at least that if it retests the low,
it is not likely to fall much below the previous low. Before QE, there would be
a high probability of a retest of the Friday low of 4326. Now, it isn’t clear.
Today’s big move was a Follow-thru day. It is defined as
follows:
“From the beginning of any attempted market rally during
a definite downtrend, a 'follow-through' day is identified when a major
index closes significantly higher, over 1% for the day, on a strong increase in
volume from the day before.”
A follow-thru day cancels the bearish Distribution Days
and confirms a new up-trend.
Today was a statistically significant up-day. That just means
that the price-volume move exceeded my statistical parameters. Statistics show
that a statistically-significant, up-day is followed by a down-day about 60% of
the time. This is the 5th statistically
significant day in the last 3-weeks. It’s now a bullish sign overall, though
tomorrow could be a day for some profit taking.
The daily sum of 20 Indicators improved from -3 to +6
today (a positive number is bullish; negatives are bearish); the 10-day
smoothed sum that smooths the daily fluctuations improved from -61 to -51 (The
trend direction is more important than the actual number for the 10-day value.)
These numbers sometimes change after I post the blog based on data that comes
in late. Most of these indicators are short-term so they tend to bounce around
a lot.
The Long Term NTSM indicator
ensemble remained HOLD. Volume is bearish; Price is bullish; VIX &
Sentiment are Neutral.
Internals improved, today. Along with the successful-test
last week, this suggested the pullback was over so I bought more stocks. The
market action, up almost all day with a strong positive close, suggests a lot of
investors agreed with me.
POSITIONS ADDED:
Last week: AAPL; XLE;
Monday: QLD; SPY
MOMENTUM ANALYSIS:
TODAY’S RANKING OF 15 ETFs
(Ranked Daily)
The top ranked ETF receives
100%. The rest are then ranked based on their momentum relative to the leading
ETF.

*For additional background on
the ETF ranking system see NTSM Page at…
http://navigatethestockmarket.blogspot.com/p/exchange-traded-funds-etf-ranking.html

TODAY’S RANKING OF THE DOW 30
STOCKS (Ranked Daily)
Here’s the revised DOW 30 and
its momentum analysis. The top ranked stock receives 100%. The rest are then ranked
based on their momentum relative to the leading stock.

For more details, see NTSM
Page at…
https://navigatethestockmarket.blogspot.com/p/a-system-for-trading-dow-30-stocks-my_8.html

MONDAY MARKET INTERNALS (NYSE
DATA)
Market Internals improved to HOLD.

Market Internals are a decent
trend-following analysis of current market action, but should not be used alone
for short term trading. They are usually right, but they are often late. They are most useful when they diverge from
the Index.
Today, I increased my
stock-allocation in the portfolio to about 65% invested in stocks. This is above
my “normal” fully invested stock-allocation of 50%. I will hold this trading-position
for a while, but it will not be a long-term hold.
I trade about 15-20% of the
total portfolio using the momentum-based analysis I provide here. If I can see
a definitive bottom, I’ll add a lot more stocks to the portfolio using an
S&P 500 ETF.
You may wish to have a higher
or lower % invested in stocks depending on your risk tolerance. 50% is a
conservative position that I consider fully invested for most retirees.
As a general rule, some
suggest that the % of portfolio invested in the stock market should be one’s
age subtracted from 100. So, a
30-year-old person would have 70% of the portfolio in stocks, stock mutual
funds and/or stock ETFs. That’s ok, but
for older investors, I usually don’t recommend keeping less than 50% invested
in stocks (as a fully invested position) since most people need some growth in
the portfolio to keep up with inflation.