“U.S. industrial production unexpectedly fell in May as manufacturing and mining activity remained weak, a sign that a strong dollar and spending cuts in the energy sector continued to constrain economic growth…Industrial output slipped 0.2 percent last month after declining 0.5 percent in April, the Federal Reserve said on Monday.” Story at…
http://www.reuters.com/article/2015/06/15/us-usa-economy-industrialoutput-idUSKBN0OV1OY20150615
Jeepers! I have been suggesting Dow Theorists are wrong in part because industrial production has been up. See market discussion below for more.
CORRECTION THIS SUMMER: UBS ANALYST (MarketWatch)
“A UBS analyst joins a chorus of technical experts who see the U.S. stock market in the process of hitting a top and expect a major correction this summer. Michael Riesner, head equity technical analyst at UBS, in a note to investors presents a number of charts to support his ‘toppish’ warnings…Riesner is [worried] about the divergence between the S&P 500 and high-yield bonds, 10-year Treasury yields and inflation expectations…“Since May last year we see fewer stocks hitting new highs and fewer stocks trading above their 200-day moving average, which mirrors increasing selectivity, as evidence of a maturing bull cycle and leading indicator for an important top,” he wrote.” Story at…
http://www.marketwatch.com/story/these-diverging-trends-point-to-a-market-correction-says-ubs-2015-06-11
My cmt: Seems reasonable to me, but it could be in the
Fall too.
 Chart from…
http://www.indexindicators.com/charts/sp500-vs-nyse-stocks-above-200d-sma-params-3y-x-x-x/
THIS MOMENT IN HISTORY (Hussman Funds)
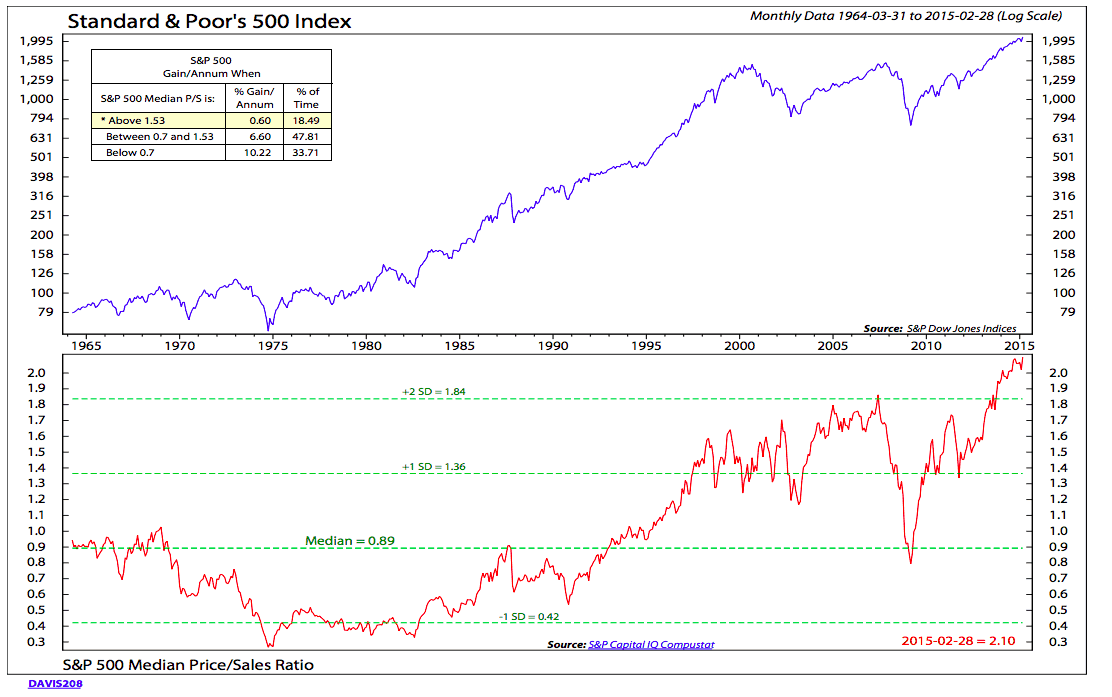
“Among the measures best correlated with actual subsequent S&P 500 total returns, capitalization-weighted market indices such as the S&P 500 were more richly valued in only 54 weeks of history, 21 of which represented the final advance to the 2000 market peak, with the remaining 33 representing the retreat from that high to present valuation levels, on the way to a 50% loss in the S&P 500 Index and an 83% loss in the Nasdaq 100 Index. Presently, the market has already lost the momentum and favorable market internals that were evident during that final run, so we doubt that the 2000 extreme should be viewed as an objective……When you look back on this moment in history, remember that the valuation of the median stock was never higher. Ever. Even at the 2000 peak.” – John Hussman, Phd. Weekly Market Commentary from…
http://www.hussmanfunds.com/wmc/wmc150615.htm
I was a believer in the bear camp 2-years ago and got burned. Now, the evidence is rising that John Hussman may be right, but there is often a 10%+ correction and recovery to near old highs before a major crash. Could this be a major crash? It could be, but I don’t have a confirmation in my numbers so I won’t panic.
I wouldn’t rule out a Greek correction. A Greek correction might be a nightmare for timers though. A “sell” might be followed by a huge rally when the Greek crisis is solved at the ninth hour, or the day after.
INTEL
I think Intel is attractive in the high 20’s, possibly even the low 30’s. The PE is currently 13 and dividend is 3%. This is a value play for the longer run. In the short run, Intel has little growth prospect since its income is almost all based on Chips for computers, laptop and desktops. The Altera acquisition should help and they are working hard to get their chips into phones…“he says he’s not dead”…and you get a good dividend while waiting. I doubled down on Intel at 30.2 back in March. For diversification, an Individual stock should not exceed more than 4% of the total portfolio to maintain diversification. If your portfolio was ALL individual stocks, it would take about 25-stocks to keep each at the 4% level.
MARKET REPORT
-Monday, the S&P 500 was up about 0.6% to 2096 at the close.
-VIX fell about 4% to 14.83.
-The yield on the 10-year Treasury Note dropped to 2.32%.
The S&P 500 is again sitting very close to its trend line.
DOW THEORY?
Comparing the S&P 500 to the XLI (SPDR Select Industrial ETF, a basket of cyclical stocks) should give some idea whether we should listen to the Dow Theorists. The Cyclical stocks in the XLI should fall faster than the S&P 500 if there is an industrial slowdown in the works. I don’t see it yet. In the short term, the XLI is performing a bit worse than the S&P 500, but not by much. Yesterday, it was slightly ahead. Over longer time-frames, it has been under-performing, again, not by much. For now, I still won’t listen to the DT’s.
Greece remains the wild card; technicals are weak, but technicals are in an area where they have reversed in the past. I’ll be looking for that reversal.
MARKET INTERNALS (NYSE DATA)
The 10-day moving average of the percentage of stocks advancing (NYSE) rose to 45% at the close Tuesday. (A number below 50% is usually BAD news for the markets.
In another bad sign for breadth, the 50-day, moving average of %-stocks rising is now below 49%, i.e., half of all stocks on the NYSE have been falling over the last 10-weeks. The last time this happened was last September and October when the S&P 500 fell 7% (on closing numbers) and this stat reliably correlates to 5% and greater pullbacks. Currently though, the S&P 500 is sitting on its lower trend line so I am not expecting too much further downside...it could happen though.
New-lows outpaced New-highs Tuesday (as was the case Monday). The spread (new-highs minus new-lows) was minus-13 (It was -68 Monday.) The 10-day moving average of change in the spread rose to minus-3. In other words, over the last 10-days, on average; the spread has decreased by 3 each day.
Internals are negative on the market, but they did improve today.

Market Internals are a decent trend-following analysis of
current market action, but should not be used alone for short term trading.
They are usually right, but they are often late. They are most useful when they diverge from
the Index. In 2014, using these internals
alone would have made a 9% return vs. 13% for the S&P 500 (in on Positive
out on Negative – no shorting). Of
course, few trend-following systems will do well in an extreme low-volatility,
nearly straight-up year like 2014.
NTSM
Tuesday, the NTSM analysis remained HOLD. PRICE is positive. VOLUME, VIX and SENTIMENT indicators are neutral, although (as always) sentiment remains extremely high.

MY INVESTED STOCK POSITION
I remain fully invested at 50% invested, mostly in smaller
cap-stocks in the long-term portfolio with some international stocks. 50% is
conservative, but appropriate for a conservative retired guy. The Dow Jones US Completion Index (all stocks except the S&P 500 – the “S” fund in the TSP) remains ahead of the S&P 500. Since 1 February it is 4% ahead of the S&P 500. Since 1 March the Euro-Pacific ETF (EFA) (“I”-fund) is 1.4% ahead of the S&P 500.
THRIFT SAVINGS PLAN (TSP) MEMBERS
My current TSP Allocation: 50%-G; 10%-C; 20%-S; 20%-I. (50% cash is too high for non-retirees, however, the “G”-fund did return 2.2% over the last 12-months and that is exceptional for risk-free money.)