“The U.S. economy posted its best six-month stretch of
growth in three years, rebounding quickly from two hurricanes and showing
momentum heading into the year’s final months. Gross domestic product—the
broadest measure of goods and services made in the U.S.—expanded at a 3% annual
rate in the third quarter…” Story at…
MICHIGAN SENTIMENT
The consumer sentiment average during the first ten
months of 2017 (96.7) has been the highest since 2000 (108.5).” Story at…
MARKET REPORT / ANALYSIS
-Friday the S&P 500 was up about 0.8% to 2581.
-VIX was down about 13% to 9.8.
-The yield on the 10-year Treasury slipped to 2.411%.
Running out of Gas:
-6% of stocks on the NYSE made new-highs today. At the
prior all-time high on 20 October, 9% of stocks made new highs.
-The 10-dMA of advancing stocks was 54% on 20 Oct. At today’s
new all-time high, only 48% of stocks were advancing on the NYSE over the last
10-days.
-Up volume was 50% of the total over the prior 10-days on
20 Oct. Today it was 47%.
Momentum is slipping. It looks like we’ll see some sort
of pullback. I don’t keep a stat on it, but while market made a new-high on the
S&P 500 Friday, two stats stand out: (1) only 48% of stocks have been
advancing over the last 10-days (2) declining volume has outpaced advancing
volume over the past 10-days. That is odd. It means the smalls aren’t participating
as they should. This isn’t unusual so it doesn’t mean there will be a crash; but
it does indicate that it is less likely that the market will continue up from
here in the short-run given other negative signs we’ve seen recently.
Last, the move Friday was statistically significant based
on the standard deviation of the price-volume when compared to recent history.
That is likely to result in a down-day Monday about 60% of the time. I wrote recently
that “…before we see any meaningful pullback, we need to put in a top. At this point another big move up, say around
1%, could mark another short-term top.” Today’s move of 0.8% didn’t quite make
my target, but I think it may be close enough. The Index is at its upper trend
line and we have certainly seen enough bearish signals for the last 6-weeks.
Bollinger Bands finally joined the bearish party with an overbought indication
today.
A pullback in the range of 3-5% would be the norm. Perhaps
we’ll finally see a bigger (10% or more move down), but that is anybody’s guess
at this point. The numbers suggest down;
but the magnitude is unknown.
Short-term I am still leaning bearish and I made a
bearish VXX buy today. It’s a risky move
as I noted several times, but with VIX below 10 and other bearish indicators I
think it is a reasonable bet. I’ll have
a low tolerance for loss and I’ll sell quickly if this trade moves against me.
I remain bullish longer-term. One wonders when this party
will end so I will worry if the numbers deteriorate, but for now I remain fully
invested.
TODAY’S RANKING OF 15 ETFs (Ranked Daily)

The top ranked ETF receives 100%. The rest are then
ranked based on their momentum relative to the leading ETF. While momentum isn’t stock performance per
se, momentum is closely related to stock performance. For example, over the 4-months
from Oct thru mid-February 2016, the number 1 ranked Financials (XLF) outperformed
the S&P 500 by nearly 20%.
*For additional background on the ETF ranking system see
NTSM Page at…
Aerospace and Defense (ITA) remained #1 today. I am in
ITA as of 21 Sept. The Financials (XLF) picked up steam presumably based on
higher interest rates as we have noticed the 10-yr bond rising recently.
I thought it would be interesting to apply the ETF
ranking system methodology to the Dow 30.
The quick way to do it was to keep the number of stocks the same as my
ETF ranking system so here is a ranking of 15 DOW stocks.
TODAY’S RANKING OF 15 DOW STOCKS (Ranked Daily)
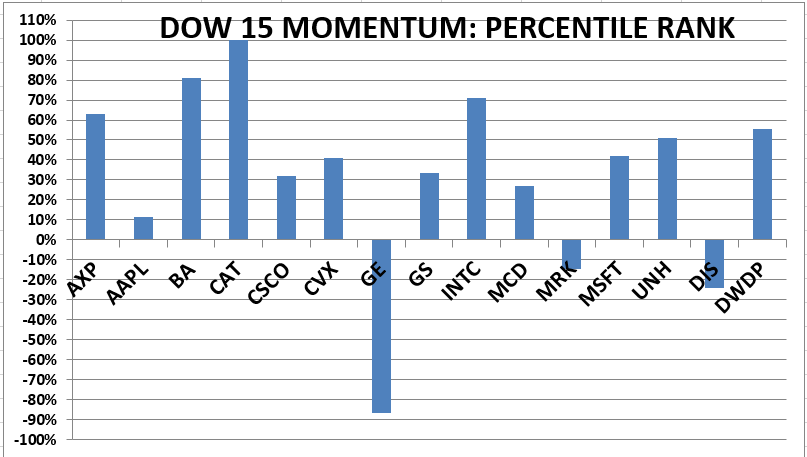
The top ranked ETF receives 100%. The rest are then
ranked based on their momentum relative to the leading ETF. Avoid GE, Merck and Disney. Their 120-day
moving averages are falling.
Caterpillar (CAT) remained #1.
*I rank the Dow 15 similarly to the ETF ranking system.
For more details, see NTSM Page at…
SHORT-TERM TRADING PORTFOLIO - 2017 (Small-% of the
total portfolio)
LONG
As noted above I did take a short-term VXX position on 27
Oct very near the close. I had intended to post it here during trading hours so
others could follow my foolishness if they wanted; but I was out working and
only noticed this set-up in the last 10-minutes of the day when I got home. This
violates the rules below, but I am eternally hopeful.
My shorting rule is as follows:
-“In a bull market, you can only be long or
neutral.” – D. Gartman
-“The best policy
is to avoid shorting unless a major bear market is underway and downside
momentum has been thoroughly established. Even then, your timing must sometimes
be perfect. In a bull market the trend is truly your friend, and trading
against the grain is usually a fool's errand.” – Clif Droke.
-“Commandment #1: “Thou Shall Not Trade Against the Trend.” - James P. Arthur Huprich
FRIDAY MARKET INTERNALS (NYSE DATA)
Market Internals remained
Neutral on the market.
Market Internals are a decent trend-following analysis of
current market action, but should not be used alone for short term trading.
They are usually right, but they are often late. They are most useful when they diverge from
the Index. In 2014, using these
internals alone would have made a 9% return vs. 13% for the S&P 500 (in on
Positive, out on Negative – no shorting).
LONG TERM INDICATOR
Friday, Sentiment,
Price, VIX & Volume indicators were neutral. With VIX recently below 10
for a couple of days in May, June, July, August, September and now October, VIX
may be prone to incorrect signals. Usually, a rising VIX is a bad market sign;
now it may move up, but that might just signal normalization of VIX, i.e., VIX
and the Index may both rise. As an indicator, VIX is out of the picture for a
while.
MY INVESTED STOCK POSITION:
TSP (RETIREMENT ACCOUNT – GOV EMPLOYEES) ALLOCATION
I increased
stock allocation to 50% stocks in the S&P 500 Index fund (C-Fund) 24 March
2017 in my long-term accounts, based on short-term indicators. The remainder
is 50% G-Fund (Government securities). This is a conservative retiree
allocation, but I consider it fully invested for my situation.
The previous signal was a BUY on 2 June and the last
actionable signal was a BUY (from a prior sell) on 15 November 2016.