“Initial jobless claims, a way to measure layoffs, sank
by 22,000 to 222,000 in the week ended Oct. 14. That’s the lowest figure since
March 1973…” Story at…
PHILADELPHIA FED (MarketWatch)
“Manufacturing activity in the mid-Atlantic heated up in
October, the Philadelphia Fed said Thursday. Its gauge jumped 4.1 points to
27.9, the strongest reading since May.” Story at…
LEI (Conference Board)
“The Conference Board Leading Economic Index® (LEI) for
the U.S. declined 0.2 percent in September to 128.6 (2010 = 100), following a
0.4 percent increase in August, and a 0.3 percent increase in July. “The US LEI
declined slightly in September for the first time in the last twelve months,
partly a result of the temporary impact of the recent hurricanes,” said Ataman
Ozyildirim, Director of Business Cycles and Growth Research at The Conference
Board…Despite September’s decline, the trend in the US LEI remains consistent
with continuing solid growth in the US economy for the second half of the
year.” Press release at…
MCDONALDS DRESSED AS A BEAR FOR HALLOWEEN? (Real
Investment Advice)
“Since 2012, MCD’s revenue has declined by nearly 12%
while its earnings per share (EPS) rose 17%. This discrepancy might lead one to
conclude that MCD’s management has greatly improved operating efficiency and
introduced massive cost-cutting measures. Not so. Similar to revenue, GAAP net
income has declined almost 8% over the same period, which rules out the
possibilities mentioned above.
To understand how earnings-per-share (EPS) can increase
at a double-digit rate, while revenue and net income
similarly decline and profit margins remain relatively flat, one must
consider the effect of share buybacks…when the day after Halloween occurs for
MCD and other stocks trading well above fair value, investors might find a
rotten apple in their portfolio and not the chocolatey goodness they imagined.”
Commentary at…
https://realinvestmentadvice.com/something-wicked-this-way-comes-mcdonalds-a-bear-in-a-bull-costume/
My cmt: This was an interesting article on passive
momentum investing and share-buybacks.
MARKET REPORT / ANALYSIS
-Thursday the S&P 500 was up about 1-point to 2562.
-VIX dipped about 0.2% to 10.05.
-The yield on the 10-year Treasury dipped to 2.322%.
Bearish signs abound:
-Utilities were the number 1 ETF on the day up more than 1%. That’s usually a bad sign for the markets as
it suggests investors were looking for safety.
-Advancing volume has been dropping for a month.
-The 10-dMA of Breadth (the % of stocks advancing on the
NYSE) is now 51%. A month ago, it was 58%
so clearly there is deterioration here.
-Over the last 2-weeks there have been only 4 down days
on the S&P 500. That level of bullishness is usually a bearish sign.
-RSI was 82, definitely in the overbought region, but the
S&P 500 remains below the upper Bollinger Band. I like to look at RSI and
Bollinger Bands together. Even together they aren’t a perfect indicator. We can
see that RSI, Bollinger Bands and the Overbought/Oversold Index were all
bearish 2-weeks ago and we haven’t had a pullback yet. On the other hand, as of
Thursday, the Index is only up about one-half % since those bearish readings.
These are some signs that the markets are
getting stretched. As always, there are some bullish signs too. Closing tick (reflecting final trades) was a
very bullish +538. Looks like there were
a lot of “buy-at-the-close” orders. Overall the sum of my 17-indicators was only -1 so there
are fair number of bullish indicators too.
The markets are still leaning toward some sort of drift
down. Short-term we appear to be due for about a 3-5% dip, and indicators are
trending in that direction especially since market internals are still trending
down. Historically, a “correction” is due in 2018 since that is the second term
of the new President at least if you believe in seasonality predictions.
Short-term I am leaning bearish, but I remain bullish longer-term. One wonders
when this party will end so I will worry if the numbers deteriorate, but for
now I remain fully invested.
TODAY’S RANKING OF 15 ETFs (Ranked Daily)
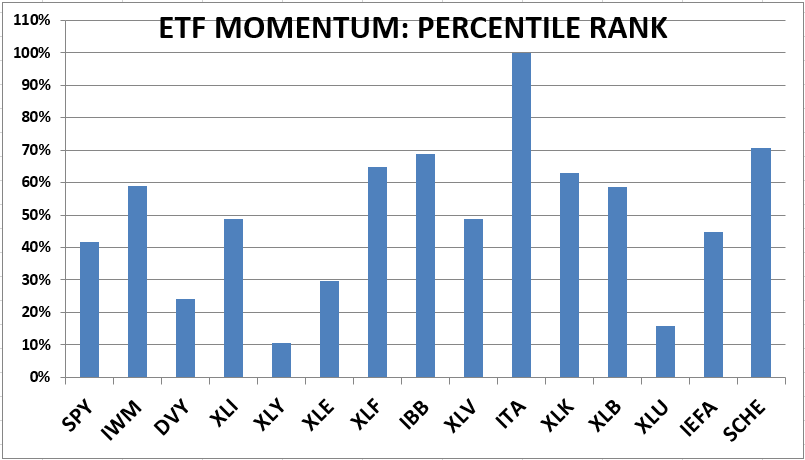
The top ranked ETF receives 100%. The rest are then
ranked based on their momentum relative to the leading ETF. While momentum isn’t stock performance per
se, momentum is closely related to stock performance. For example, over the 4-months
from Oct thru mid-February 2016, the number 1 ranked Financials (XLF) outperformed
the S&P 500 by nearly 20%.
*For additional background on the ETF ranking system see
NTSM Page at…
Aerospace and Defense (ITA) remained #1 today. I am in
ITA as of 21 Sept.
My trade in ITA is up 2.5% in the month I’ve owned it.
SHORT-TERM TRADING PORTFOLIO - 2017 (Small-% of the
total portfolio)
LONG
Repeating again…and again… and again…
It is tempting to make a VXX trade if and when we get a
big move up signaling a short-term top.
VIX is at extreme lows. VXX would be a bet against the market and higher
VIX – essentially a short. This is a
risky trade since as VIX options expire, they must be replaced with more
expensive options (referred to as contango).
For this reason, VXX will lose value even if VIX stays the same. I need
a really good set-up before I’ll trade VXX or short. I am not there yet.
My shorting rule is as follows:
-“In a bull market, you can only be long or
neutral.” – D. Gartman
-“The best policy
is to avoid shorting unless a major bear market is underway and downside
momentum has been thoroughly established. Even then, your timing must sometimes
be perfect. In a bull market the trend is truly your friend, and trading
against the grain is usually a fool's errand.” – Clif Droke.
-“Commandment #1: “Thou Shall Not Trade Against the Trend.” - James P. Arthur Huprich
THURSDAY MARKET INTERNALS (NYSE DATA)
Market Internals
remained Neutral on the market.
Market Internals are a decent trend-following analysis of
current market action, but should not be used alone for short term trading.
They are usually right, but they are often late. They are most useful when they diverge from
the Index. In 2014, using these
internals alone would have made a 9% return vs. 13% for the S&P 500 (in on
Positive, out on Negative – no shorting).
LONG TERM INDICATOR
Thursday, the Price
indicator was positive; Sentiment, VIX & Volume indicators were neutral.
With VIX recently below 10 for a couple of days in May, June, July, August,
September and now October, VIX may be prone to incorrect signals. Usually, a
rising VIX is a bad market sign; now it may move up, but that might just signal
normalization of VIX, i.e., VIX and the Index may both rise. As an indicator,
VIX is out of the picture for a while.
MY INVESTED STOCK POSITION:
TSP (RETIREMENT ACCOUNT – GOV EMPLOYEES) ALLOCATION
I increased
stock allocation to 50% stocks in the S&P 500 Index fund (C-Fund) 24 March
2017 in my long-term accounts, based on short-term indicators. The remainder
is 50% G-Fund (Government securities). This is a conservative retiree
allocation, but I consider it fully invested for my situation.
The previous signal was a BUY on 2 June and the last
actionable signal was a BUY (from a prior sell) on 15 November 2016.