"This imaginary person out there - Mr. Market - he's
kind of a drunken psycho. Some days he gets very enthused, some days he gets
very depressed. And when he gets really enthused, you sell to him and if he
gets depressed you buy from him. There's no moral taint attached to that."
- Warren
Buffett
“The big money is not in the buying and selling. But in the
waiting.” - Charlie Munger, Vice Chairman, Berkshire Hathaway
JOBLESS CLAIMS (MarketWatch)
“Some 1.88 million Americans applied for traditional
jobless benefits at the end of May and another 623,000 filed new claims under a
federal-relief program, but the number of unemployed collecting government
checks appears to have stabilized as more workers return to their jobs.” Story
at…
CORONAVIRUS (NTSM)
Here’s the latest from the COVID19 Johns Hopkins website
as of 8:30PM. There were 22,000 new cases today, about the same as yesterday.
The 14-day growth factor was 1.08, indicating growth in new cases of about 8%
per day. While the curve has flattened,
we can see that the curve is not diverging from the dashed line, an indication
that the growth rate is little changed over the last month.
These numbers are based on U.S. totals; local data will
be different.

MARKET REPORT / ANALYSIS
-Thursday the S&P 500 dipped about 0.3% to 3112.
-VIX rose about 0.6% to 25.81.
-The yield on the 10-year Treasury was 0.813%.
I still see my problem indicator giving a bear signal. Breadth
on the NYSE vs the S&P 500 index has drastically diverged from the S&P
500 index in a bearish manner. The Index
remains way too far ahead of breadth, at least using moving average comparisons
that have usually proved to be correct. Money Trend flipped to the bear side,
too. RSI is still bearish, but Bollinger Bands are not yet giving a bear sign.
In general, though, the preponderance of indicators
remains bullish.
The daily sum of 20 Indicators remained +8 (a
positive number is bullish; negatives are bearish). The 10-day smoothed sum
that negates the daily fluctuations declined from +74 to +72. (These
numbers sometimes change after I post the blog based on data that comes in
late.) Most of these indicators are short-term.
The Fosback High/Low Logic Index remains bullish. This
Indicator is bullish when both new-highs and new-lows are small numbers and it
is very bullish now.
We’ll need to see more bear signs before we start to
worry. While it goes against logic, the market is surprisingly bullish. The
Cyclical Industrials (XLI-ETF) are outperforming the S&P 500 Index and look
quite strong. Investors wouldn’t be
buying cyclicals if they were worried about a continuing recession. The
opposite end of the investment world is signaling the same thing. Utilities are underperforming the Index; it
would be reversed if investors were worried. (Momentum doesn’t show this well,
but momentum isn’t price.)
I increased stock holdings to about 30% of the portfolio
total Tuesday, and will add more later. This dip may provide us a better
buying opportunity…or maybe the rally will end with a bang and a rapid decline?
It seems less likely now than it did just a few weeks ago.
MOMENTUM ANALYSIS:
TODAY’S RANKING OF
15 ETFs (Ranked Daily)

The top ranked ETF receives 100%. The rest are then
ranked based on their momentum relative to the leading ETF. The highest ranked are those closest to zero.
While momentum isn’t stock performance per se, momentum is closely related to
stock performance. For example, over the 4-months from Oct thru mid-February
2016, the number 1 ranked Financials (XLF) outperformed the S&P 500 by
nearly 20%. In 2017 Technology (XLK) was ranked in the top 3 Momentum Plays for
52% of all trading days in 2017 (if I counted correctly.) XLK was up 35% on the
year while the S&P 500 was up 18%.
*For additional background on the ETF ranking system see
NTSM Page at…
TODAY’S RANKING OF THE DOW 30 STOCKS (Ranked Daily)
The top ranked stock receives 100%. The rest are then
ranked based on their momentum relative to the leading stock.
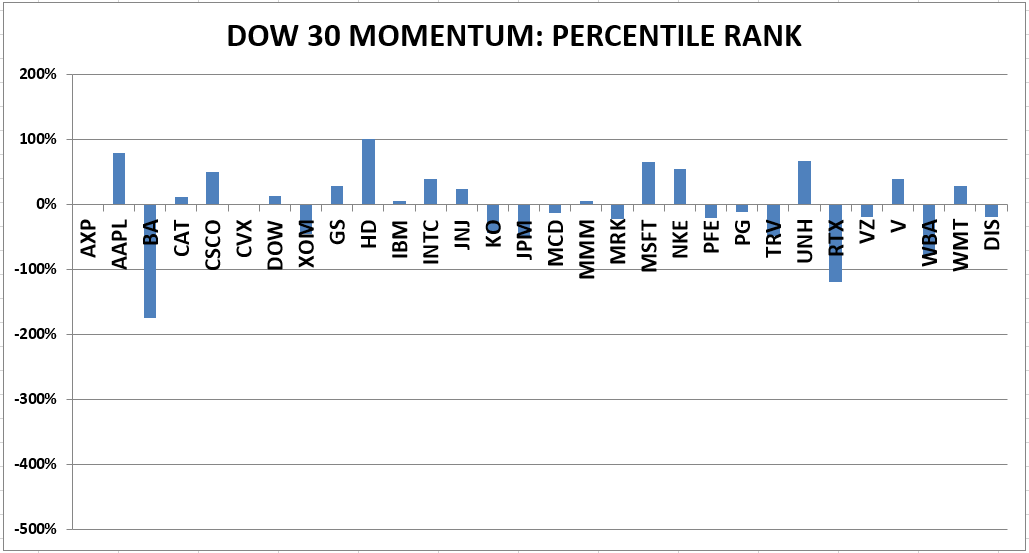
For more details, see NTSM Page at…
THURSDAY MARKET INTERNALS (NYSE DATA)
Market Internals remained
BULLISH on the market.
Market Internals are a decent trend-following analysis of
current market action, but should not be used alone for short term trading.
They are usually right, but they are often late. They are most useful when they diverge from
the Index. In 2014, using these
internals alone would have made a 9% return vs. 13% for the S&P 500 (in on
Positive, out on Negative – no shorting).
Using the Short-term indicator in 2018 in SPY would have
made a 5% gain instead of a 6% loss for buy-and-hold. The methodology was Buy
on a POSITIVE indication and Sell on a NEGATIVE indication and stay out until
the next POSITIVE indication. The back-test included 13-buys and 13-sells, or a
trade every 2-weeks on average.
My current stock allocation is about 30% invested in
stocks. You may wish to have a higher or lower % invested in stocks depending
on your risk tolerance.