"This imaginary person out there - Mr. Market - he's
kind of a drunken psycho. Some days he gets very enthused, some days he gets
very depressed. And when he gets really enthused, you sell to him and if he
gets depressed you buy from him. There's no moral taint attached to that."
- Warren
Buffett
“The big money is not in the buying and selling. But in the
waiting.” - Charlie Munger, Vice Chairman, Berkshire Hathaway
NON-DIVERGENCES BETTER THAN DIVERGENCES (McClellan
Financial Publications)
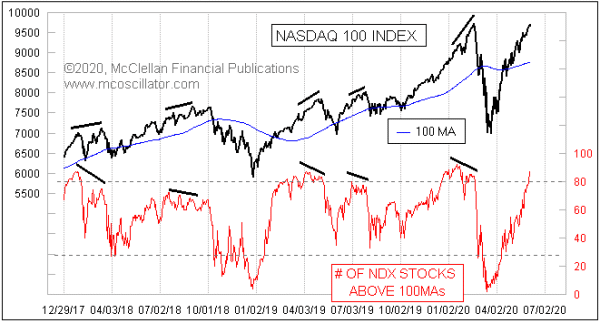
“The indicator in the bottom of the chart measures the
number of component stocks in the Nasdaq 100 which are above their own 100-day
moving averages…This indicator gives great divergences at price tops that
matter. So for that attribute, it is a wonderful indicator. The
duration of the divergences can vary, which is frustrating, but they all end up
being proven to be “right” eventually. An indicator which is right eventually is
not necessarily what you want to follow for trading signals… In this case,
though, the absence of a divergent top at an overbought condition for this
indicator is a pretty reliable sign that there is an intact uptrend.” – Tm McClellan.
Commentary at…
CORONAVIRUS (NTSM)
Here’s the latest from the COVID19 Johns Hopkins website
as of 5 PM. While the curve has flattened, indicating slowed growth, we can see
that the curve is not diverging from the dashed line, an indication that the
growth rate is little changed over the last month.

-Monday the S&P 500 rose about 1.2% to 3232.
-VIX rose about 5% to 25.81.
-The yield on the 10-year Treasury slipped to 0.882%.
I increased stock holdings to about 50% of the portfolio
today, continuing to join the stampede while wondering if I was buying the top.
Bollinger Bands and RSI both remained overbought. I need to remember that
overbought conditions can remain in place for a while, especially after an important
bottom. That bottom was long ago so we
still have to wonder how much higher the markets will go. If the markets fail, this might turn out to be the shortest I've bought to "fully-invested" and then sold out.
Today, the NYSE saw a 90% up-volume day that finished
with strong momentum meeting the Lowry Research tests for a bullish up-volume
signal. It just confirms bullishness, as if we hadn’t seen enough recently.
My guess is that the S&P 500 will take out its prior
high of 3386, but if it does, it defies logic. In the meantime, I’ll look for
more bearish signs from my indicators. I want to see signs that internals are
failing; I’ll sell some stocks when they do.
The daily sum of 20 Indicators improved from +10
to +11 (a positive number is bullish; negatives are bearish). The 10-day
smoothed sum that negates the daily fluctuations improved from +74 to +85.
(These numbers sometimes change after I post the blog based on data that comes
in late.) Most of these indicators are short-term.
MOMENTUM ANALYSIS:
TODAY’S RANKING OF
15 ETFs (Ranked Daily)

*For additional background on the ETF ranking system see
NTSM Page at…
TODAY’S RANKING OF THE DOW 30 STOCKS (Ranked Daily)
The top ranked stock receives 100%. The rest are then
ranked based on their momentum relative to the leading stock.

For more details, see NTSM Page at…
MONDAY MARKET INTERNALS (NYSE DATA)
Market Internals remained
BULLISH on the market.
Market Internals are a decent trend-following analysis of
current market action, but should not be used alone for short term trading.
They are usually right, but they are often late. They are most useful when they diverge from
the Index. In 2014, using these
internals alone would have made a 9% return vs. 13% for the S&P 500 (in on
Positive, out on Negative – no shorting).
Using the Short-term indicator in 2018 in SPY would have
made a 5% gain instead of a 6% loss for buy-and-hold. The methodology was Buy
on a POSITIVE indication and Sell on a NEGATIVE indication and stay out until
the next POSITIVE indication. The back-test included 13-buys and 13-sells, or a
trade every 2-weeks on average.
My current stock allocation is about 50% invested in
stocks. You may wish to have a higher or lower % invested in stocks depending
on your risk tolerance. As a retiree, 50% in the stock market is about fully
invested for me – it is a cautious and conservative number. If I feel very
confident, I might go to 60%; had we seen a successful retest of the bottom, 80%
would not have been out of the question.