"This imaginary person out there - Mr. Market - he's
kind of a drunken psycho. Some days he gets very enthused, some days he gets
very depressed. And when he gets really enthused, you sell to him and if he
gets depressed you buy from him. There's no moral taint attached to that."
- Warren
Buffett
“The big money is not in the buying and selling. But in the
waiting.” - Charlie Munger, Vice Chairman, Berkshire Hathaway
JOBLESS CLAIMS (CNN Business)
“Another 963,000 Americans filed for regular first-time
unemployment benefits last week on a seasonally adjusted basis — the first time
in five months that number has dipped below 1 million, the Department of Labor said
Thursday…Continued jobless claims, which count people who have filed for
unemployment benefits for a at least two weeks in a row, stood at 15.5 million
on a seasonally adjusted basis. Without the adjustment, the number was 15.2
million.” Story at…
BUFFET INDICATOR SOUNDING THE ALARM (MarkegtWatch)
“Global stock mkts have hit another milestone. All stocks
[are] now worth more than 100% of global GDP for the 1st time since 2018,
pointing to stretched valuations. For Warren Buffett, a Market Cap to GDP Ratio
>100% means stocks in bubble territory.” - Holger Zschäpitz. Commentary at…
CORONAVIRUS (NTSM)
Here’s the latest from the COVID19 Johns Hopkins website at
5:40 Thursday. I’ve plotted the daily numbers on the right side of the graph
with a 10-dMA of daily numbers in Green.

MARKET REPORT / ANALYSIS
-Thursday the S&P 500 dipped about 0.2% to 3373.
-VIX rose about 0.7% to 22.13.
-The yield on the 10-year Treasury rose to 0.723%.
We’ve still only seen 2 down-days in the last 2 weeks of
trading. That’s a bearish sign, but since today was down, we didn’t get a
strong bear signal based on the daily count of up vs down moves. There are
other bear signs though.
The S&P 500 is 10.1% above its 200-dMA. Values in the
10-15% range are sell-signal. While this could signal a major top, it could
presage just a 3-5% pullback. The Index was 11.5% above its 200-day when the
Coronavirus crash began. It was 8.6% above its 200-day before the 6% retreat in
July of 2019. The “%-above-the-200-day” is pretty strong signal and it suggests
that we will see at least some choppy trading and perhaps a more significant
pullback.
There was a bearish crossover 31 July for MACD of Breadth.
It would seem to be fairly reliable divergence since the Index was headed up at
the time.
Still, we haven’t seen a run of negative indicators
(Bollinger Bands and RSI didn’t signal a top), so we’re left with a thought
that maybe Wednesday was a top, but it isn’t a done deal.
In order for it to be THE Top, we’d need to see investors
decide to take a “risk-off” stance.
The daily sum of 20 Indicators slipped from +6 to
+3 (a positive number is bullish; negatives are bearish). The 10-day smoothed
sum that smooths the daily fluctuations improved from +40 to +48. (These
numbers sometimes change after I post the blog based on data that comes in
late.) Most of these indicators are short-term.
Looks like some sort of pullback is here. Big or small? I
don’t know, but long-term indicators still look good so we might expect “small”.
My guess is that we'll see a 6% pullback to the 50-dMA (3189); that would be very logical.
The 200-dMA is 3062. After that, we'll see.
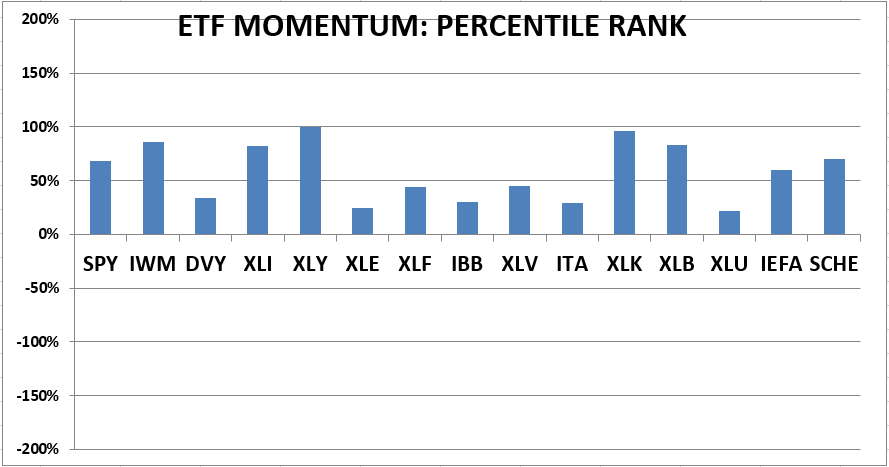
MOMENTUM ANALYSIS:
TODAY’S RANKING OF
15 ETFs (Ranked Daily)
The top ranked ETF receives 100%. The rest are then
ranked based on their momentum relative to the leading ETF.
*For additional background on the ETF ranking system see
NTSM Page at…
TODAY’S RANKING OF THE DOW 30 STOCKS (Ranked Daily)
The top ranked stock receives 100%. The rest are then
ranked based on their momentum relative to the leading stock.

For more details, see NTSM Page at…
I sold Microsoft, perhaps too early. We’ll see. Its PE is
36. MSFT has been higher, I just thought it was frothy as well as the entire market.
Checking some of the momentum leaders in the DOW 30 we
see:
Apple has a PE of 34; that’s higher than its been in the
last 3 years and it only has a Dividend of 0.75%. I am not currently a fan of Apple
stock; it seems too expensive. Home Depot has a PE of 28. That seems high for a hardware store, but at
least it has a dividend of 2.18%. DOW is losing money, but it has a dividend of
6.25%. (All data from Yahoo finance.) DOW is the one I own of that group.
THURSDAY MARKET INTERNALS (NYSE DATA)
Market Internals remained
NEUTRAL on the market.
Market Internals are a decent trend-following analysis of
current market action, but should not be used alone for short term trading.
They are usually right, but they are often late. They are most useful when they diverge from
the Index.
Using the Short-term indicator in 2018 in SPY would have
made a 5% gain instead of a 6% loss for buy-and-hold. The methodology was Buy
on a POSITIVE indication and Sell on a NEGATIVE indication and stay out until
the next POSITIVE indication. The back-test included 13-buys and 13-sells, or a
trade every 2-weeks on average.
My current stock allocation is about 40% invested in
stocks. You may wish to have a higher or lower % invested in stocks depending
on your risk tolerance. 40% is a conservative position that I re-evaluate
daily. It is not far below my fully invested position which would be between
50-60%.
As a retiree, 50% in the stock market is about fully
invested for me – it is a cautious and conservative number. If I feel very
confident, I might go to 60%; had we seen a successful retest of the bottom,
80% would not have been out of the question.