“Trade what you see; not what you think.” – The Old Fool,
Richard McCranie, trader extraordinaire.
"This imaginary person out there - Mr. Market - he's
kind of a drunken psycho. Some days he gets very enthused, some days he gets
very depressed. And when he gets really enthused, you sell to him and if he gets
depressed you buy from him. There's no moral taint attached to that." - Warren
Buffett
“The big money is not in the buying and selling. But in the
waiting.” - Charlie Munger, Vice Chairman, Berkshire Hathaway
JULIAN BREAM PASSED AWAY (NPR / YouTube)
My cmt: I am saddened to hear of Julian Bream’s passing. I
play classical guitar because I heard Julian Bream play a Bach Fugue at The Kennedy
Center in the early 70’s. Later, I met him when my guitar-teacher promoted his
concert here in Norfolk. He was a giant
of the classical guitar. Here, Bream plays the Lute version of the Fugue from Bach’s
Violin Sonata #1, BWV 1000…
HOUSING STARTS / PERMITS (Reuters)
“Housing starts increased 22.6% - the biggest gain since
October 2016 - to a seasonally adjusted annual rate of 1.496 million units last
month…Building permits issuance, considered a more forward-looking gauge of
residential construction activity, also accelerated in July. Permits issuance
totaled 1.495 million units at an annualized rate, up 18.8% from 1.258 million
in June.” Storoy at…
CORONAVIRUS (NTSM)
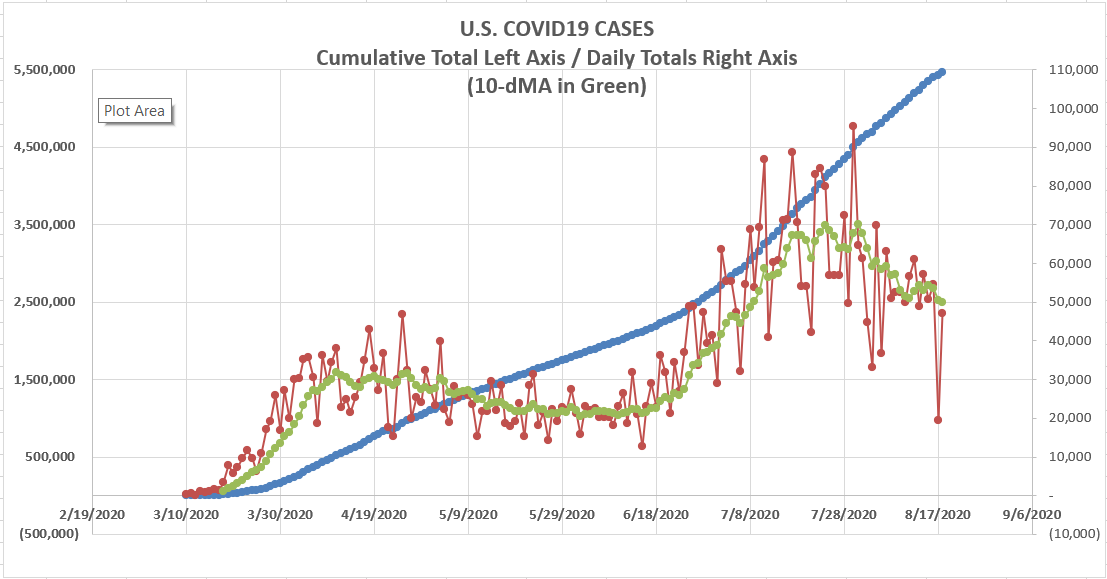
Here’s the latest from the COVID19 Johns Hopkins website
at 5:20 Tuesday. Total US numbers are on the left axis. I’ve plotted the daily
numbers on the right side of the graph with a 10-dMA of daily numbers in Green.
Numbers are higher, but falling. This is
good news. New cases continue to fall. August weather has been a pain so far,
but at least the Covid numbers are headed in the right direction – the Pros said late summer would
probably bring a respite.
MARKET REPORT / ANALYSIS
-Tuesday the S&P 500 rose about 0.2% 3390.
-VIX rose about 0.8% to 21.51.
-The yield on the 10-year Treasury dipped to 0.665%.
The S&P 50 made a new all-time high today, but only 3.3%
of issues on the NYSE made new 52-week highs. That’s not a bear sign, but it
would be if it was less than 3%. This shows what we’ve known for a while, there
are not enough issues participating in the advance.
An all-time high?
That means the correction top to bottom was 23-days long with a drop of
34%. Wow. Sharp and deep. We’ll have to wait and see if it’s really over. There could still be a retest of the low if Covid
comes back in the fall.
Home Depot same-store-sales leapt higher by more than 20%.
The stock fell more than 1% today. This is probably
not a good sign for the market.
The daily sum of 20 Indicators slipped from +1 to -1 (a
positive number is bullish; negatives are bearish). The 10-day smoothed sum
that smooths the daily fluctuations remained +63. (These numbers sometimes
change after I post the blog based on data that comes in late.) Most of these
indicators are short-term.
Here’s the rising wedge pattern I mentioned
yesterday. The pattern also holds if drawn
from the March low. It is resolving now and this suggests a top.

I know it’s boring to read the same thing every day, but
the conclusion hasn’t changed much: It looks like we are due for a pullback
soon, but it could take longer than I expect. The wild card is the Fed. Can they hold off normal market action? Have
they ended all corrections? We’ll see.
MOMENTUM ANALYSIS:
TODAY’S RANKING OF
15 ETFs (Ranked Daily)
The top ranked ETF receives 100%. The rest are then
ranked based on their momentum relative to the leading ETF.

*For additional background on the ETF ranking system see
NTSM Page at…
TODAY’S RANKING OF THE DOW 30 STOCKS (Ranked Daily)
The top ranked stock receives 100%. The rest are then
ranked based on their momentum relative to the leading stock.

For more details, see NTSM Page at…
TUESDAY MARKET INTERNALS (NYSE DATA)
Market Internals
remained NEUTRAL on the market.
Market Internals are a decent trend-following analysis of
current market action, but should not be used alone for short term trading.
They are usually right, but they are often late. They are most useful when they diverge from
the Index.
Using the Short-term indicator in 2018 in SPY would have
made a 5% gain instead of a 6% loss for buy-and-hold. The methodology was Buy
on a POSITIVE indication and Sell on a NEGATIVE indication and stay out until
the next POSITIVE indication. The back-test included 13-buys and 13-sells, or a
trade every 2-weeks on average.
My current stock allocation is about 40% invested in
stocks. You may wish to have a higher or lower % invested in stocks depending
on your risk tolerance. 40% is a conservative position that I re-evaluate
daily. It is not far below my fully invested position which would be between
50-60%.
As a retiree, 50% in the stock market is about fully
invested for me – it is a cautious and conservative number. If I feel very
confident, I might go to 60%; had we seen a successful retest of the bottom,
80% would not have been out of the question.