“Trade what you see; not what you think.” – The Old Fool,
Richard McCranie, trader extraordinaire.
“The big money is not in the buying and selling. But in
the waiting.” - Charlie Munger, Vice Chairman, Berkshire Hathaway
“Bubbles tend to topple under their own weight. Everybody
is in. The last short has covered. The last buyer has bought (or bought massive
amounts of weekly calls). The decline starts and the psychology shifts from
greed to complacency to worry to panic. Our working hypothesis, which might be
disproven, is that September 2, 2020 was the top and the bubble has already
popped.” - David Einhorn, Greenlight hedge fund.
My cmt: The 2 Sept high was 3581, so it looks like David Einhorn
was too early.
CONSUMER CONFIDENCE (Conference Board)
“The Conference Board Consumer Confidence Index® improved
moderately in January, after decreasing in December. The Index now stands at
89.3 (1985=100), up from 87.1 in December. However, the Present Situation Index
– based on consumers’ assessment of current business and labor market
conditions – decreased from 87.2 to 84.4. The Expectations Index – based on
consumers’ short-term outlook for income, business, and labor market conditions
– increased from 87.0 in December to 92.5 this month... “Consumers’ appraisal
of present-day conditions weakened further in January, with COVID-19 still the
major suppressor,” said Lynn Franco, Senior Director of Economic Indicators at
The Conference Board. “Consumers’ expectations for the economy and jobs,
however, advanced further, suggesting that consumers foresee conditions
improving in the not-too-distant future.” Press release at...
https://www.conference-board.org/data/consumerconfidence.cfm
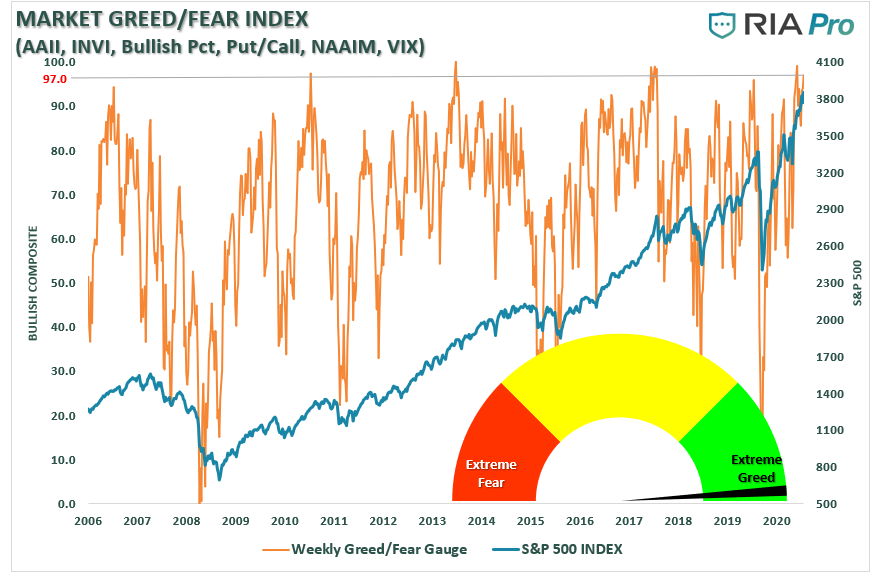
TECHNICALLY SPEAKING: WHY WE REDUCED RISK LAST WEEK –
Excerpt Pub., 26 Jan (RIA)
“Even though we took gains in our index positions, we
remain primarily long-biased in our equity and ETF portfolios. However, given
the extreme technical overbought and deviated conditions, it was prudent to
raise some cash and protect our gains... Currently, with investor’s extremely
long equity exposure, the risk of a correction has become more elevated.” Lance
Roberts.

Commentary and charts at...
https://realinvestmentadvice.com/wp-content/uploads/2021/01/image_2021-01-23_092315.png
CORONAVIRUS (NTSM)
Here’s the latest from the COVID19 Johns Hopkins website as
of 5:20pm Tuesday. US total case numbers are on the left axis; daily numbers
are on the right side of the graph with the 10-dMA of daily numbers in Green.

MARKET REPORT / ANALYSIS
-Tuesday the S&P 500 dipped
about 0.2% to 3850.
-VIX rose about 6% to 23.19.
-The yield on the 10-year
Treasury closed little changed at 1.041%.
Yesterday, the volume was extremely high, about 55%
higher than the monthly average volume. I was tempted to call it a blow-off
top, but we didn’t see Bollinger Bands or RSI confirm the move. Today, we see
some more possible cracks in the windshield.
All the major Indices were down Tuesday, varying from the
smallest loss - about 0.1% for the DJIA and NASDAQ, to a drop of about 0.6% for
the Russell 2000. It looks like the mood on Wall Street may be changing.
The daily sum of 20 Indicators improved from -6 to -3 (a
positive number is bullish; negatives are bearish); but the 10-day smoothed sum
that smooths the daily fluctuations declined from -6 to -10. (These numbers
sometimes change after I post the blog based on data that comes in late.) Most
of these indicators are short-term and many are trend following.
The Long Term NTSM indicator
ensemble remained HOLD. Price is bullish; Volume, VIX & Sentiment are neutral.
I still think we are near a short-term top based on % over the 200-dMA and a
couple of other indicators.
I’ll continue to keep a low %
of funds in the stock market until I see a better buying point.
MOMENTUM ANALYSIS:
TODAY’S RANKING OF 15 ETFs (Ranked Daily)
The top ranked ETF receives
100%. The rest are then ranked based on their momentum relative to the leading
ETF.

*For additional background on
the ETF ranking system see NTSM Page at…
http://navigatethestockmarket.blogspot.com/p/exchange-traded-funds-etf-ranking.html
TODAY’S RANKING OF THE DOW 30
STOCKS (Ranked Daily)
Here’s the revised DOW 30 and
its momentum analysis. The top ranked stock receives 100%. The rest are then
ranked based on their momentum relative to the leading stock.

For more details, see NTSM
Page at…
https://navigatethestockmarket.blogspot.com/p/a-system-for-trading-dow-30-stocks-my_8.html
TUESDAY MARKET INTERNALS (NYSE
DATA)

Market Internals remained NEUTRAL on the market.
Market Internals are a decent
trend-following analysis of current market action, but should not be used alone
for short term trading. They are usually right, but they are often late. They are most useful when they diverge from
the Index.
Using the Short-term indicator
in 2018 in SPY would have made a 5% gain instead of a 6% loss for buy-and-hold.
The methodology was Buy on a POSITIVE indication and Sell on a NEGATIVE
indication and stay out until the next POSITIVE indication. The back-test
included 13-buys and 13-sells, or a trade every 2-weeks on average.

My current stock allocation is
about 30% invested in stocks. You may wish to have a higher or lower % invested
in stocks depending on your risk tolerance. 30% is a very conservative position
that I re-evaluate daily.
The markets have not
retested the lows on recent corrections and that has left me under-invested on
the bounces. I will need to put less reliance on retests in the future.
As a retiree, 50% in the stock
market is about fully invested for me – it is a cautious and conservative
number. If I feel very confident, I might go to 60%; if a correction is deep
enough, 80% would not be out of the question.