“Trade what you see; not what you think.” – The Old Fool,
Richard McCranie, trader extraordinaire.
“The big money is not in the buying and selling. But in
the waiting.” - Charlie Munger, Vice Chairman, Berkshire Hathaway
“Bubbles tend to topple under their own weight. Everybody
is in. The last short has covered. The last buyer has bought (or bought massive
amounts of weekly calls). The decline starts and the psychology shifts from
greed to complacency to worry to panic. Our working hypothesis, which might be
disproven, is that September 2, 2020 was the top and the bubble has already
popped.” - David Einhorn, Greenlight hedge fund.
My cmt: The 2 Sept high was 3581, so it looks like
David Einhorn was too early.

WHAT WERE THEY THINKING? (The Felder Report)

Here’s what Scott McNeely, then CEO of Sun Microsystems, said
during the dot.com crash 20 years ago:
“At 10 times revenues, to give you a 10-year payback, I have
to pay you 100% of revenues for 10 straight years in dividends. That assumes I
can get that by my shareholders. That assumes I have zero cost of goods sold,
which is very hard for a computer company. That assumes zero expenses, which is
really hard with 39,000 employees. That assumes I pay no taxes, which is very
hard. And that assumes you pay no taxes on your dividends, which is kind of
illegal. And that assumes with zero R&D for the next 10 years, I can
maintain the current revenue run rate. Now, having done that, would any of you
like to buy my stock at $64? Do you realize how ridiculous those basic
assumptions are? You don’t need any transparency. You don’t need any footnotes.
What were you thinking?”
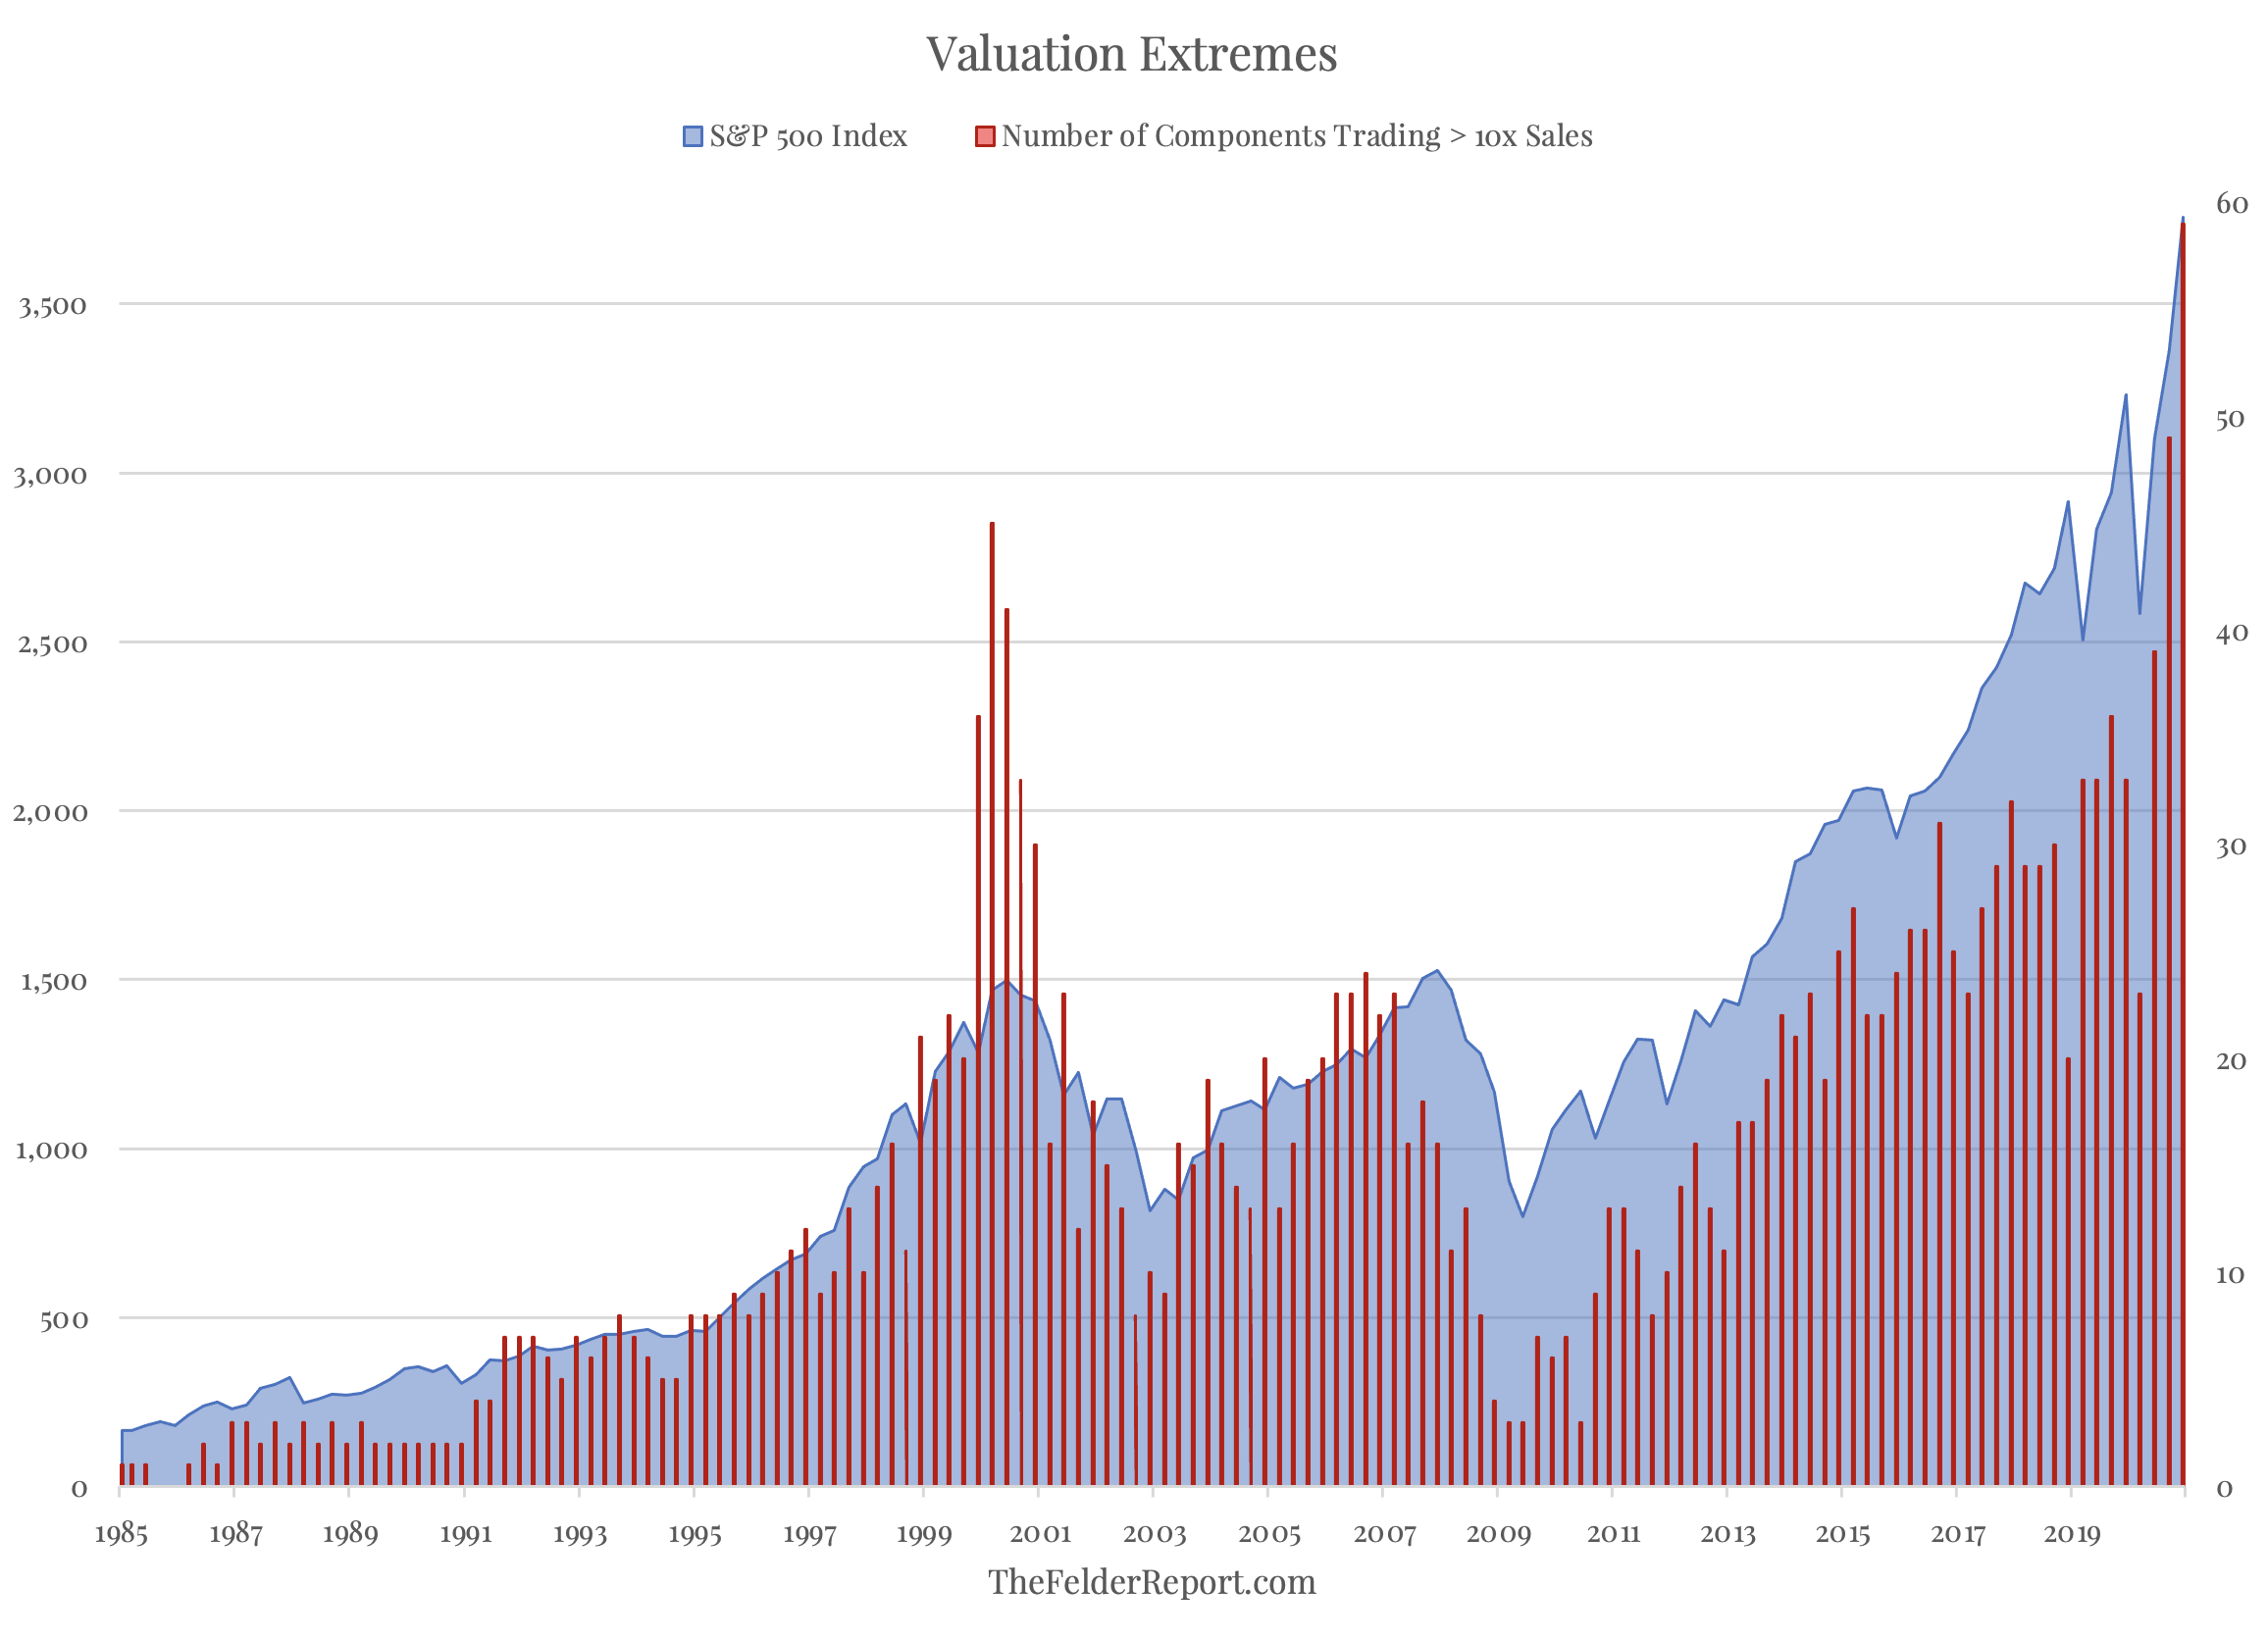
“Indeed, what were investors thinking 20 years ago not
only paying 10 times revenues for Sun Microsystems but also paying that
ridiculous multiple for 44 other stocks in the S&P 500 Index? ...It’s
interesting to note that we seem to have found even more fools today than we
did back then. Nearly 60 of the S&P 500 Index components currently trade
more than 10 times revenues [see above chart].” – Jesse Felder, The Felder Report at...
https://thefelderreport.com/wp-content/uploads/2021/01/Screen-Shot-2021-01-04-at-11.25.19-AM.png
HUSSMAN COMMENTARY EXCERPT (Hussman Funds)
“Though our most reliable measures of market valuations
presently exceed levels observed at both the 1929 and 2000 market peaks, there’s
no assurance...[that now]...is the peak of a cyclical bull market. What I can
say with reasonable confidence is that present conditions – a combination of
record valuations, “overvalued, overbought, overbullish” conditions, the
current degree of overextension, and critically, fresh deterioration in
our key gauge of market internals – are permissive of steep and
abrupt market losses.
Put simply, the present constellation of market
conditions creates the potential for the sort of “trap door” situation we observed
in March. Still, an improvement in our measures of market internals would ease
this risk, and could even create a constructive opportunity if improved market
internals are first preceded by a material retreat in market valuations.” –
John Hussman, Phd.
https://www.hussmanfunds.com/comment/mc210118/
CORONAVIRUS (NTSM)
Here’s the latest from the COVID19 Johns Hopkins website as
of 6:30pm Tuesday. US total case numbers are on the left axis; daily numbers
are on the right side of the graph with the 10-dMA of daily numbers in Green.

MARKET REPORT / ANALYSIS
-Tuesday the S&P 500 rose
about 0.8% to 3799.
-VIX dropped about 5% to 23.24.
-The yield on the 10-year
Treasury rose to 1.097%.
The first sign of a major stock market crash is in place.
Valuations are extreme. The second,
Sentiment, is also nearly at extreme warning levels. I measure Sentiment as %-Bulls
(Bulls/{bulls+bears}) based on the amounts invested in Rydex/Guggenheim mutual
funds. On a standard deviation basis, values have not reached the extremes seen
during the dot.com crash, but they are close. 2 other elements, (bad economy,
negative FED) that might precede major stock market crash are not here yet.
(1) The GDPNow model estimate for real GDP growth
(seasonally adjusted annual rate) in the fourth quarter of 2020 is 7.4 percent on
January 15. (2) The FED is pumping liquidity like crazy. Until that slows, we
probably don’t have to worry about a major stock market event, except for some
news-driven, unforeseen event.
I said over the weekend that it looked like the S&P
500 had made a short-term top. It wasn’t
a strong signal and a new high in the near term would cancel my top call. We’ll see. The S&P 500 is still stretched
at 14.9% above its 200-dMA (Sell point is 12%.), but indicators improved on the
strong positive day.
The daily sum of 20 Indicators declined from -5 to +4 (a
positive number is bullish; negatives are bearish). The 10-day smoothed sum
that smooths the daily fluctuations declined from +6 to +13. (These numbers
sometimes change after I post the blog based on data that comes in late.) Most
of these indicators are short-term and many are trend following.
The Long Term NTSM indicator
ensemble remained HOLD. Volume is bullish: Price, VIX & Sentiment are
neutral. I still think we are near a short-term top based on % over the 200-dMA
and a couple of other indicators.
I’ll continue to keep a low %
of funds in the stock market until I see a better buying point.
MOMENTUM ANALYSIS:
TODAY’S RANKING OF 15 ETFs (Ranked Daily)
The top ranked ETF receives
100%. The rest are then ranked based on their momentum relative to the leading
ETF.

*For additional background on
the ETF ranking system see NTSM Page at…
http://navigatethestockmarket.blogspot.com/p/exchange-traded-funds-etf-ranking.html
TODAY’S RANKING OF THE DOW 30
STOCKS (Ranked Daily)
Here’s the revised DOW 30 and
its momentum analysis. The top ranked stock receives 100%. The rest are then
ranked based on their momentum relative to the leading stock.

For more details, see NTSM
Page at…
https://navigatethestockmarket.blogspot.com/p/a-system-for-trading-dow-30-stocks-my_8.html
We note the banks have moved
into 1st and 2nd place in DOW momentum. I lean toward JPM
due to its higher dividend yield, 2.6%. Bank should do well as interest rates
rise, although I’d expect rates to fall if we see a decent pullback.
TUESDAY MARKET INTERNALS (NYSE
DATA)

Market Internals improved to BULLISH on the market.
Market Internals are a decent
trend-following analysis of current market action, but should not be used alone
for short term trading. They are usually right, but they are often late. They are most useful when they diverge from
the Index.
Using the Short-term indicator
in 2018 in SPY would have made a 5% gain instead of a 6% loss for buy-and-hold.
The methodology was Buy on a POSITIVE indication and Sell on a NEGATIVE
indication and stay out until the next POSITIVE indication. The back-test included
13-buys and 13-sells, or a trade every 2-weeks on average.

My current stock allocation is
about 30% invested in stocks. You may wish to have a higher or lower % invested
in stocks depending on your risk tolerance. 30% is a very conservative position
that I re-evaluate daily.
The markets have not
retested the lows on recent corrections and that has left me under-invested on
the bounces. I will need to put less reliance on retests in the future.
As a retiree, 50% in the stock
market is about fully invested for me – it is a cautious and conservative
number. If I feel very confident, I might go to 60%; if a correction is deep
enough, 80% would not be out of the question.