“Trade what you see; not what you think.” – The Old Fool,
Richard McCranie, trader extraordinaire.
“The big money is not in the buying and selling. But in
the waiting.” - Charlie Munger, Vice Chairman, Berkshire Hathaway
“Bubbles tend to topple under their own weight. Everybody
is in. The last short has covered. The last buyer has bought (or bought massive
amounts of weekly calls). The decline starts and the psychology shifts from
greed to complacency to worry to panic. Our working hypothesis, which might be disproven, is that September
2, 2020 was the top and the bubble has already popped.” - David
Einhorn, Greenlight hedge fund.
My cmt: The 2 Sept high was 3581, so it looks like
David Einhorn was too early.
LARGER CORRECTION COMING? (Real Investment Advice)
“Despite the “seeming” exuberance of the market
over the last few months, money flows have continued to weaken... While the
market could indeed bounce in the short-term, the decline in “money
flows,” and the convergence of “sell signals,” does increase our
concern of a bigger decline over the next month or so...we will likely get a
rally as early as next week. However, it is likely we should consider using any
rally to remove excess risk until the technical backdrop improves.” – Lance
Roberts. Commentary & analysis at...
https://realinvestmentadvice.com/technically-speaking-is-a-larger-correction-coming/
YES, THIS IS A CORRECTION (Morgan Stanley/stknews)
“[Monday] morning, none other than Goldman's biggest
competitor on Wall Street, Morgan Stanley, appears to have come to the same
conclusion as Goldman, with the bank's chief equity strategist Michael Wilson
writing that "oer the last few weeks we suggested a correction was nigh
although we didn't have a catalyst. Now we
do – positioning and leverage should do the rest." Commentary at...
https://news.stknews.com/news?s=all&n=7382390
HOUSE DEMOCRATS MAKE THEIR CASE (WSJ)
“In a trial brief submitted to the Senate Tuesday
morning, the managers wrote that “it is unthinkable that those same Framers
left us virtually defenseless against a president’s treachery in his final
days, allowing him to misuse power, violate his Oath, and incite insurrection
against Congress and our electoral institutions simply because he is a lame
duck. There is no ‘January Exception’ to impeachment or any other provision of
the Constitution.” Story at...
House
Democrats Make Case for Convicting Trump (msn.com)
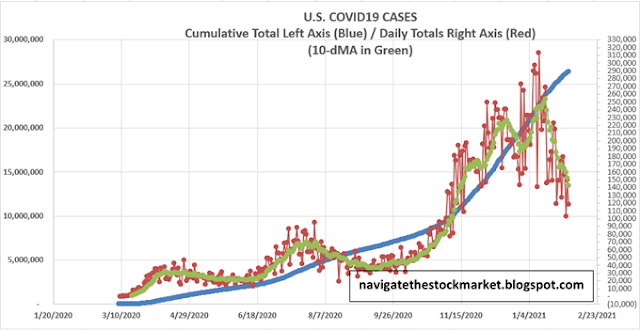
CORONAVIRUS (NTSM)
Here’s the latest from the COVID19 Johns Hopkins website as
of 6:20pm Tuesday. US total case numbers are on the left axis; daily numbers
are on the right side of the graph with the 10-dMA of daily numbers in Green.
MARKET REPORT / ANALYSIS
-Tuesday the S&P 500 again
rose about 1.6% to 3826.
-VIX dropped about 5% to 25.56.
-The yield on the 10-year
Treasury rose to 1.0101%.
Two big up-days in a row. The
dip-buyers have moved in big-time. Short-term Indicators are improving, but
many are trend following. We always need to remember that no indicator predicts
the future. I’d be surprised if the pullback has ended so quickly, but I have been
surprised before. Mr. Market doesn’t follow my indicators.
While indicators are improving, there are still internal warning
signs. Two are: (1) The spread between Cyclical Industrials (XLI) and the
S&P 500 is still bearishly deteriorating. If investors were confident, XLI
would be out-performing the Index. (2) Utilities (XLU) are underperforming the
S&P 500, but this trend is also bearishly falling. If investors were
confident, we wouldn’t see XLU falling sharply relative to the Index. Still,
neither are guarantees since they are based on moving averages of the spread. Pullback over?
The daily sum of 20 Indicators improved from -7 to -4 (a
positive number is bullish; negatives are bearish); but the 10-day smoothed sum
that smooths the daily fluctuations declined from -51 to -59. (These numbers
sometimes change after I post the blog based on data that comes in late.) Most
of these indicators are short-term and many are trend following.
The Long Term NTSM indicator
ensemble improved to HOLD. VIX is Bearish. Volume, Sentiment & Price
are neutral. The last time my NTSM Long-Term Indicator was as negative as it
was on 29 Jan, was 4 days after the Coronavirus Top, on 19 February 2020.
That’s not a guarantee that we’ll see a 20%-correction, but it is concerning.
S&P 500 correction(?)
data:
-Day 6
-S&P 500 down 0.8% from
the top – that’s hardly worth calling it a correction.
-2.7% above the 50-dMA. (The
S&P 500 closed at the 50-dMA.)
-13.9% above the 200-dMA.
(Bearish again.)
Avg Length of < 10%
Corrections: 33-trading days
Avg Length of > 10%
Corrections: 61-trading days (ignoring crashes)
We’re due for a down day. Let’s see what happens tomorrow.
The Index is still stretched too far above its 200-dMA.
MOMENTUM ANALYSIS:
TODAY’S RANKING OF 15 ETFs (Ranked Daily)
The top ranked ETF receives
100%. The rest are then ranked based on their momentum relative to the leading
ETF.
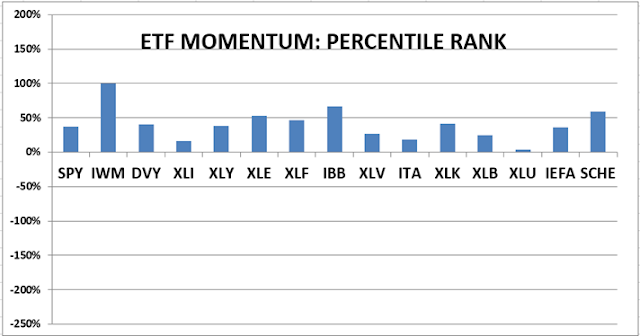
*For additional background on
the ETF ranking system see NTSM Page at…
http://navigatethestockmarket.blogspot.com/p/exchange-traded-funds-etf-ranking.html
TODAY’S RANKING OF THE DOW 30
STOCKS (Ranked Daily)
Here’s the revised DOW 30 and
its momentum analysis. The top ranked stock receives 100%. The rest are then
ranked based on their momentum relative to the leading stock.

For more details, see NTSM
Page at…
https://navigatethestockmarket.blogspot.com/p/a-system-for-trading-dow-30-stocks-my_8.html
TUESDAY MARKET INTERNALS (NYSE
DATA)

Market Internals remained NEUTRAL on the market.
Market Internals are a decent
trend-following analysis of current market action, but should not be used alone
for short term trading. They are usually right, but they are often late. They are most useful when they diverge from
the Index.
Using the Short-term indicator
in 2018 in SPY would have made a 5% gain instead of a 6% loss for buy-and-hold.
The methodology was Buy on a POSITIVE indication and Sell on a NEGATIVE
indication and stay out until the next POSITIVE indication. The back-test
included 13-buys and 13-sells, or a trade every 2-weeks on average.

My current stock allocation is
about 30% invested in stocks. You may wish to have a higher or lower % invested
in stocks depending on your risk tolerance. 30% is a very conservative position
that I re-evaluate daily.
The markets have not
retested the lows on recent corrections and that has left me under-invested on
the bounces. I will need to put less reliance on retests in the future.
As a retiree, 50% in the stock
market is about fully invested for me – it is a cautious and conservative
number. If I feel very confident, I might go to 60%; if a correction is deep
enough, 80% would not be out of the question.