“Trade what you see; not what you think.” – The Old Fool,
Richard McCranie, trader extraordinaire.
“The big money is not in the buying and selling. But in
the waiting.” - Charlie Munger, Vice Chairman, Berkshire Hathaway
“People always ask me what is going on in the markets. It
is simple. Greatest Speculative Bubble of All Time in All Things. By two orders
of magnitude.” – Michael “Big Short” Burry.
“I never imagined that I would see the day that the
Chairman of the House Judiciary Committee would step forward to call for raw [Supreme]
court packing. It is a sign of our current political environment where rage
overwhelms reason.” - Professor Jonathan Turley, honorary Doctorate of Law from
John Marshall Law School for his contributions to civil liberties and the
public interest.
LEADING ECONOMIC INDICATORS – LEI (Conference Board)
The Conference Board Leading Economic
Index® (LEI) for the U.S. increased by 1.3 percent in May to
114.5 (2016 = 100), following a 1.3 percent increase in April and a 1.4 percent
increase in March. "After another large improvement in May, the U.S. LEI
now stands above its previous peak reached in January 2020 (112.0),
suggesting that strong economic growth will continue in the near term,"
said Ataman Ozyildirim, Senior Director of Economic Research at The Conference
Board.” Press release at...
JOBLESS CLAIMS (CNBC)
“Initial jobless claims unexpectedly rose last week
despite an ongoing recovery in the U.S. employment market, the Labor Department
reported Thursday. First-time filings for unemployment insurance for the week ended
June 12 totaled 412,000...” Story at...
https://www.cnbc.com/2021/06/17/us-weekly-jobless-claims.html
PHILADELPHIA FED INDEX (Reuters)
“Factory activity in the U.S. mid-Atlantic region
declined for the second consecutive month in June after hitting its highest
pace in nearly half a century earlier this spring, a survey showed on Thursday.
The Philadelphia Federal Reserve Bank said its business
activity index fell to 30.7...” Story at...
https://www.reuters.com/world/us/philly-fed-factory-activity-edges-lower-june-2021-06-17/
RATE HIKES GOOD FOR BANKS (CNBC)
“Higher rates sooner can allow banks to finally earn more
money on all those deposits that they gathered...and give a tailwind to banks...
[news of rate hikes expected sooner] was good for banks...” – Mike Mayo, Sr.
Analyst at Wells Fargo. Video interview at...
He also said that the down side is inflation. Inflation is “hell” for banks, but Wells
Fargo doesn’t expect inflation to continue.
SLOWLY AT FIRST – THEN ALL AT ONCE (RIA)
“...the reason investors “get trapped” in bear markets is
that when they realize what is happening, it is far too late to do anything
about it...Pay attention to the market. The action this year is very reminiscent of
previous market topping processes. Tops are hard to
identify during the process as “change happens slowly.” The mainstream
media, economists, and Wall Street will dismiss pickup in volatility as simply
a corrective process. But when the topping process completes, it will seem as if
the change occurred “all at once.” Commentary at...
https://realinvestmentadvice.com/technically-speaking-slowly-at-first-then-all-at-once/
CORONAVIRUS (NTSM)
Here’s the latest from the COVID19 Johns Hopkins website as
of 9:45 PM Thursday. US total case numbers are on the left axis; daily numbers
are on the right side of the graph with the 10-dMA of daily numbers in Green.

MARKET REPORT / ANALYSIS
-Thursday the S&P 500
dipped about 0.04% to 4222.
-VIX dipped about 2% to 17.75.
-The yield on the 10-year
Treasury was 1.514%.
I never saw very many top
indicators at Monday’s top. Both RSI and
Bollinger Bands were close to overbought warnings, but never got to extremes we
usually see at tops. That suggests (but
doesn’t guarantee) that a pullback would be smaller (if we do have a pullback). My guess is that the 50-dMA would be the
bottom or near the bottom for this pullback. As of today’s close, the Index is 1%
above its 50-dMA.
The daily sum of 20 Indicators dropped from zero to -6 (a
positive number is bullish; negatives are bearish); the 10-day smoothed sum
that smooths the daily fluctuations dropped from +54 to +45. (These numbers
sometimes change after I post the blog based on data that comes in late.) Most
of these indicators are short-term and many are trend following.
The Long Term NTSM indicator
ensemble remained HOLD. Price is Bullish; Volume, VIX, & Sentiment are
neutral.
I am bullish until we see more
bearish signs.
MOMENTUM ANALYSIS:
TODAY’S RANKING OF 15 ETFs
(Ranked Daily)
The top ranked ETF receives
100%. The rest are then ranked based on their momentum relative to the leading
ETF.

*For additional background on
the ETF ranking system see NTSM Page at…
http://navigatethestockmarket.blogspot.com/p/exchange-traded-funds-etf-ranking.html
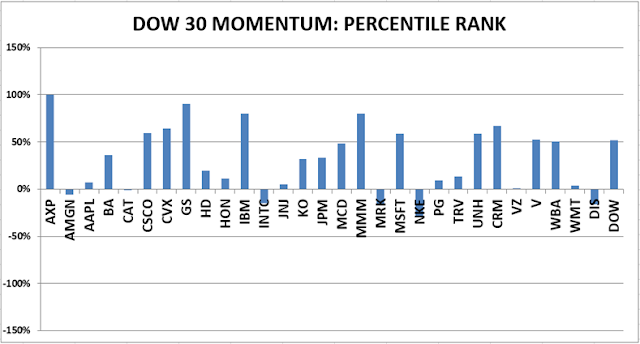
TODAY’S RANKING OF THE DOW 30
STOCKS (Ranked Daily)
Here’s the revised DOW 30 and
its momentum analysis. The top ranked stock receives 100%. The rest are then
ranked based on their momentum relative to the leading stock.
For more details, see NTSM
Page at…
https://navigatethestockmarket.blogspot.com/p/a-system-for-trading-dow-30-stocks-my_8.html
THURSDAY MARKET INTERNALS
(NYSE DATA)

Market Internals remained NEUTRAL on the market.
Market Internals are a decent
trend-following analysis of current market action, but should not be used alone
for short term trading. They are usually right, but they are often late. They are most useful when they diverge from
the Index.
Using the Short-term indicator
in 2018 in SPY would have made a 5% gain instead of a 6% loss for buy-and-hold.
The methodology was Buy on a POSITIVE indication and Sell on a NEGATIVE
indication and stay out until the next POSITIVE indication. The back-test
included 13-buys and 13-sells, or a trade every 2-weeks on average.

As of 25 May, my
stock-allocation is about 50% invested in stocks. I am not super bullish, but I
am not bearish either so 50% is a reasonable allocation for me.
You may wish to have a higher
or lower % invested in stocks depending on your risk tolerance. 50% is a
conservative position that I consider fully invested for most retirees. As a
retiree, 50% in the stock market is about fully invested for me – it is a
cautious and conservative number. If I feel very confident, I might go to 60%;
if a correction is deep enough, and I can call a bottom, 80% would not be out
of the question.
The markets have not
retested the lows on recent corrections and that left me under-invested on the
bounces. I will need to put less reliance on retests in the future.