“Slightly more Americans filed for jobless claims last week but the labor market remains one of strongest parts of the U.S. economy. Applications for unemployment benefits rose to 230,000 for the week ending Dec. 3, up by 4,000 from the previous week’s 226,000...About 1.67 million people were receiving jobless aid the week that ended Nov. 26, up 62,000 from the week before.” Story at...
https://www.detroitnews.com/story/business/2022/12/08/us-jobless-claims-unemployment-benefits/69711431007/
“The markets are also squarely in the middle of the final bout of tax loss selling for 2022. Seasonal trends continue to be weak into next week. The stock market is supposed to put in its final low for the year next week or by the middle of the following week and then rally into January. That’s what historical trends say, but not all years conform to those norms, 2018 being a very costly exception.” - Paul Schatz, President Heritge Capital. Commentary at...
https://investfortomorrow.com/blog/semis-banks-offer-opposing-views-home-heating-oil-update/
-Thursday the S&P 500 rose about 0.8% to 3964.
-VIX slipped about 2% to 22.29.
-The yield on the 10-year Treasury rose to 3.486%.
-Drop from Top: 17.4% as of today. 25.4% max (on a closing basis).
-Trading Days since Top: 235-days.
The S&P 500 is 1.9% BELOW its 200-dMA & 3.4% above its 50-dMA.
I am doing less trading now. You may do better watching the momentum charts rather than my moves.
QLD – 2x Nas 100
DDM – 2x Dow 30.
XLK – Technology ETF
Kiplinger’s Personal Finance magazine reported that the Fidelity Blue Chip Growth Fund was down 40% as of 4 November vs the S&P 500 that was down 18%. I hope your mutual funds are doing better. The Fidelity fund must have been heavily in the high-flying tech stocks – live by the sword; die by the sword.
“The Bollinger Band Squeeze occurs when volatility falls to low levels and the Bollinger Bands narrow. According to John Bollinger, periods of low volatility are often followed by periods of high volatility. Therefore, a volatility contraction or narrowing of the bands can foreshadow a significant advance or decline.”
https://school.stockcharts.com/doku.php?id=trading_strategies:bollinger_band_squeeze
Bollinger said that RSI should be used to determine the move direction. With RSI leaning toward lower (Bullish) levels, the Index near its lower Bollinger Band and my long-term indicator decidedly bullish, I expect the move to be higher.
I think the bottom was 3577 on 12 October. There is always the possibility that the markets could retest those lows, but it seems unlikely that a retest will occur in 2022.
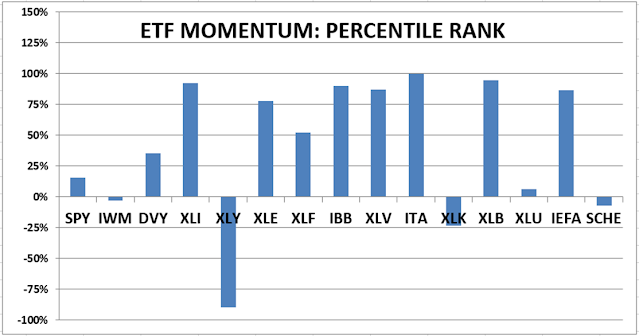
BEST ETFs - MOMENTUM ANALYSIS:
TODAY’S RANKING OF 15 ETFs (Ranked Daily)
ETF ranking follows:
*For additional background on the ETF ranking system see NTSM Page at…
http://navigatethestockmarket.blogspot.com/p/exchange-traded-funds-etf-ranking.html
DOW 30 momentum ranking follows:

For more details, see NTSM Page at…
https://navigatethestockmarket.blogspot.com/p/a-system-for-trading-dow-30-stocks-my_8.html

(Market Internals are a decent trend-following analysis of current market action, but should not be used alone for short term trading. They are most useful when they diverge from the Index.)