“Trade what you see; not what you think.” – The Old Fool, Richard McCranie, trader extraordinaire.
My cmt: I can’t believe I actually voted for this clown. Trump belongs in jail for his seditious false election claims and his attempts to install phony electors in the electoral college. He’s the one guilty of fraud, yet he continues to claim “stolen election” without providing a shred of evidence.
“Economic activity in the services sector grew in November for the 30th month in a row...“In November, the Services PMI® registered 56.5 percent, 2.1 percentage points higher than October’s reading of 54.4 percent... Based on comments from Business Survey Committee respondents, increased capacity and shorter lead times have resulted in a continued improvement in supply chain and logistics performance. A new fiscal period and the holiday season have contributed to stronger business activity and increased employment.” Report at...
https://www.ismworld.org/supply-management-news-and-reports/reports/ism-report-on-business/services/november/
“New orders for U.S.-manufactured goods increased more than expected in October amid strong gains in demand for machinery and a range of other goods, which could allay concerns of a sharp slowdown in manufacturing. The Commerce Department said on Monday that factory orders jumped 1.0% after rising 0.3% in September.” Story at...
https://www.reuters.com/markets/us/us-factory-orders-beat-expectations-october-2022-12-05/
-Monday the S&P 500 dropped about 1.8% to 3999.
-VIX rose about 9% to 20.75.
-The yield on the 10-year Treasury rose to 3.585%.
-Drop from Top: 16.6% as of today. 25.4% max (on a closing basis).
-Trading Days since Top: 232-days.
The S&P 500 is 1.1% BELOW its 200-dMA & 4.7% above its 50-dMA. (The last rally failed at the 200-dMA. The Index closed above its 200-dMA on 3 consecutive days and that’s a very good sign. Now it’s fallen below it, so it is a concern.)
*I won’t call the correction over until the S&P 500 makes a new-high; however, evidence suggests the bottom was in the 3600 area and I am fully invested with a higher percentage of stocks than normal.
XLI – Industrial ETF (XLI still looks good to me. Nearly 10% of XLI is in Boeing and Caterpillar and they are both strong performers in the DOW momentum analysis.)
QLD – 2x Nas 100
DDM – 2x Dow 30. I may sell DDM and replace it with SSO (2x S&P 500), but for now, the DOW 30 is still doing better than the S&P 500.
XLK – Technology ETF
3900 remains a key level for the S&P 500 since it represents the lower trend-line of the current up-trend. As long as that holds, days like today aren’t cause for panic.
-The 10-dMA percentage of issues advancing on the NYSE (Breadth) is above 50%.
-The 50-dMA percentage of issues advancing on the NYSE (Breadth) is above 50%.
-The 100-dMA percentage of issues advancing on the NYSE (Breadth) is above 50%
This shows that the rally off the lows has been broadening. The 50-day and the 100-day averages finally tracked above 50% last week, and overall, Friday indicators remain at extreme bullish levels.
“A single, isolated 90% Downside Day does not, by itself, have any long-term trend implications, since they often occur at the end of short-term corrections. But, because they show that investors are in a mood to panic, even an isolated 90% Downside Day should be viewed as an important warning that more could follow.” - Identifying Bear Market Bottoms - Lowry Research
BEST ETFs - MOMENTUM ANALYSIS:
TODAY’S RANKING OF 15 ETFs (Ranked Daily)
ETF ranking follows:
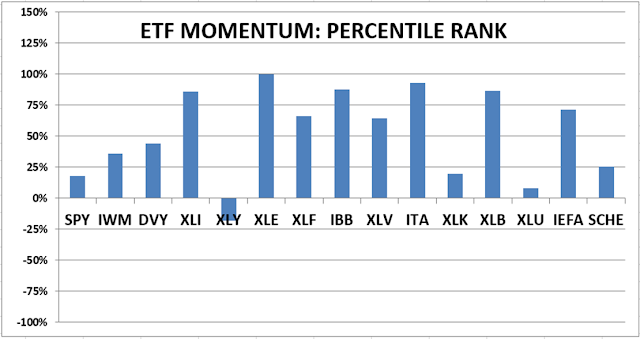 The top ranked ETF receives
100%. The rest are then ranked based on their momentum relative to the leading
ETF.
The top ranked ETF receives
100%. The rest are then ranked based on their momentum relative to the leading
ETF.*For additional background on the ETF ranking system see NTSM Page at…
http://navigatethestockmarket.blogspot.com/p/exchange-traded-funds-etf-ranking.html
 BEST DOW STOCKS - TODAY’S MOMENTUM
RANKING OF THE DOW 30 STOCKS (Ranked Daily)
BEST DOW STOCKS - TODAY’S MOMENTUM
RANKING OF THE DOW 30 STOCKS (Ranked Daily)DOW 30 momentum ranking follows:

https://navigatethestockmarket.blogspot.com/p/a-system-for-trading-dow-30-stocks-my_8.html

MONDAY MARKET INTERNALS (NYSE DATA)

(Market Internals are a decent trend-following analysis of current market action, but should not be used alone for short term trading. They are most useful when they diverge from the Index.)