Best DOW Stocks ... Best ETFs … Stock Market Analysis ... Housing & Permits
“Trade what you see; not what you think.” – The Old Fool,
Richard McCranie, trader extraordinaire.
"If I was Darth Vader and I wanted to destroy the US
economy, I would do aggressive spending in the middle of an already hot
economy...This is the biggest bubble I've seen in my career." - Stanley
Druckenmiller, billionaire investor. (27 July 2021, back when the CPI was
around 3.0.)
“Trade what you see; not what you think.” – The Old Fool,
Richard McCranie, trader extraordinaire.
HOUSING STARTS / BUILDING PERMITS (Yahoo Finance)
“’In short, ignore the headline starts numbers,’ Ian
Shepherdson, chief economist at Pantheon Macroeconomics, wrote. ‘The collapse
in single-family permits is the real story, and it has much further to go.’ Residential
starts — including both single- and multi-family units — increased 12.2% last
month...
https://finance.yahoo.com/news/housing-starts-permits-152522177.html
MARKET REPORT / ANALYSIS
-Tuesday the S&P 500 fell about 1.1% to 3856.
-VIX rose about 5% to 27.16.
-The yield on the 10-year Treasury rose to 3.564%.
PULLBACK DATA:
-Drop from Top: 19.6% as of today. 23.6% max.
-Trading Days since Top: 179-days.
The S&P 500 is 9.3% Below its 200-dMA & 4.6%
Below its 50-dMA.
Support looks like the prior low, 3667.
*I won’t call the correction over until the S&P 500
makes a new-high; however, we hope to be able to call the bottom when we see
it.
MY TRADING POSITIONS:
SH, short the S&P 500 ETF.
SDS, 2x short S&P 500 ETF.
I have built these positions to significantly large
values, although I am still not net short.
TODAY’S COMMENT:
There was another Distribution Day today. That makes 10 in the last 25 sessions. 6 is considered
bearish, so this is very bearish.
“A distribution day is when a market representative index...[in
my case the S&P 500] loses more than 0.2% in a trading session, with volume
higher than that of the previous session.” - https://marketsmithindia.com/post/is-this-a-market-top-distribution-days-give-an-idea
Distribution Days are thought to indicate that the big money
is selling.
...But not all signs are bearish.
While the S&P 500 is trending toward its prior low of
3667 back in June. The number of stocks advancing on the NYSE does not (so far)
seem to be headed to new-lows. We’ll see when the Index retests that low, but we
might get a positive divergence with Breadth and that could be bullish. Whether
that will occur, or be enough to trigger a buy-signal, remains to be seen.
The FED will release their rate decision Wednesday at
2pm. At this point, a 75-basis point
hike might be a chance for a relief rally? Should be exciting...
The Pros on CNBC Fast Money are pointing out that valuations
remain high and the earnings estimates must fall. Bottom line, Dan Nathan expects the Index to
fall through the June lows. He has been
predicting a low around 3300 on the S&P 500 for some time.
Today, the daily sum of 20 Indicators declined from -4 to
-9 (a positive number is bullish; negatives are bearish); the 10-day smoothed
sum that smooths the daily fluctuations declined from +11 to -4. (The trend
direction is more important than the actual number for the 10-day value.) These
numbers sometimes change after I post the blog based on data that comes in
late. Most of these 20 indicators are short-term so they tend to bounce
around a lot.
LONG-TERM INDICATOR: The Long
Term NTSM indicator declined to SELL: the Panic Indicator is bearish; VOLUME
and VIX are bearish; SENTIMENT & PRICE are neutral. I expect the S&P
500 to test its prior low of 3667. Remember for the longer-term, one indicator
trumps them all – “Don’t fight the FED.”
I have been saying for a while that I think we remain in
a selling stampede. Maybe-maybe not. Selling stampedes usually last 17 – 25
sessions, with only 1.5-to three-day pauses/throwback rallies, before
they exhaust themselves on the downside. As of today, this downturn has lasted
24-days, but we might need to start a new count since we did recently have 4
up-days in a row.
I’m a Bear; a retest of the prior lows (or close to the
lows) seems likely.
BEST ETFs - MOMENTUM ANALYSIS:
TODAY’S RANKING OF 15 ETFs
(Ranked Daily)
*For additional background on
the ETF ranking system see NTSM Page at…
http://navigatethestockmarket.blogspot.com/p/exchange-traded-funds-etf-ranking.html
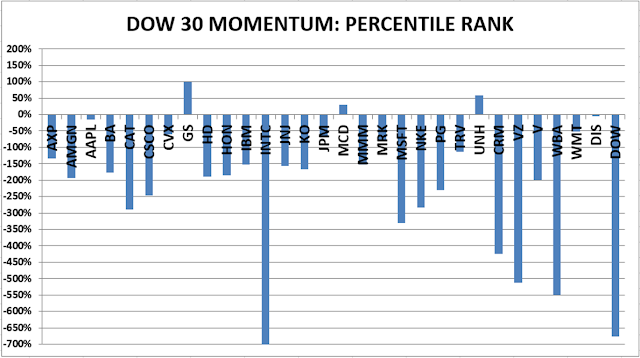
BEST DOW STOCKS - TODAY’S MOMENTUM
RANKING OF THE DOW 30 STOCKS (Ranked Daily)
Here’s the revised DOW 30 and
its momentum analysis. The top ranked stock receives 100%. The rest are then
ranked based on their momentum relative to the leading stock.
For more details, see NTSM
Page at…
https://navigatethestockmarket.blogspot.com/p/a-system-for-trading-dow-30-stocks-my_8.html
TUESDAY MARKET INTERNALS (NYSE
DATA)
My basket of Market Internals remained NEUTRAL.
(Market Internals are a decent trend-following
analysis of current market action, but should not be used alone for short term
trading. They are most useful when they diverge from the Index.)
My stock-allocation in the
portfolio is now roughly 30% invested in stocks.
I trade about 15-20% of the
total portfolio using the momentum-based analysis I provide here. If I can see
a definitive bottom, I’ll add a lot more stocks to the portfolio using an
S&P 500 ETF.