“Trade what you see; not what you think.” – The Old Fool, Richard McCranie, trader extraordinaire.
“Economic activity in the services sector grew in August for the 27th month in a row...The report was issued today by Anthony Nieves, CPSM, C.P.M., A.P.P., CFPM, Chair of the Institute for Supply Management® (ISM®) Services Business Survey Committee: ‘In August, the Services PMI® registered 56.9 percent, 0.2 percentage point higher than July's reading of 56.7 percent... Growth continues — at a slightly faster rate — for the services sector, which has expanded for all but two of the last 151 months. The services sector had a slight uptick in growth for the month of August due to increases in business activity, new orders and employment.’” Press release at...
https://www.prnewswire.com/news-releases/services-pmi-at-56-9-august-2022-services-ism-report-on-business-301617838.html
“President Biden just wiped out what is estimated to be $1 trillion owed to the country [per the Wharton School of Business] — the size of the Reagan budget — without a single vote, let alone approval, by Congress. The idea of a president giving away such a fortune with the stroke of a pen should alarm every American. Not only will the massive payout likely fuel inflation but critics have objected to having working-class people subsidize the debts of college-educated citizens...This is not supposed to happen in a constitutional system based on shared, limited powers: The Constitution gives Congress the power of the purse, but Biden just gave away the store.” – Professor Jonathan Turley, honorary Doctorate of Law from John Marshall Law School. Commentary at...
https://jonathanturley.org/2022/09/02/college-loan-forgiveness-plan-reveals-bidens-constitutional-cynicism/
Who made Biden King? He accuses Trump of threatening Democracy while he ignores it.
-Tuesday the S&P 500 fell about 0.4% to 3908.
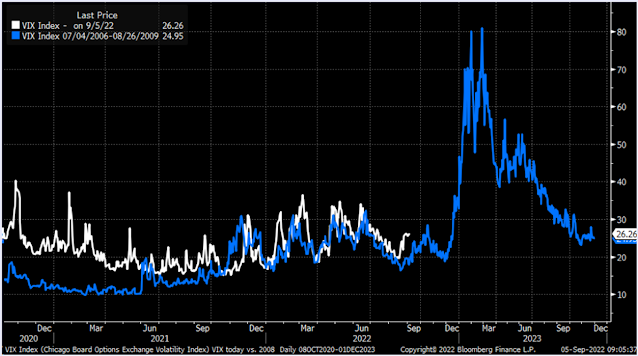
-VIX rose about 6% to 26.91.
-The yield on the 10-year Treasury climbed to 3.355%.
-Drop from Top: 18.5% as of today. 23.6% max.
-Trading Days since Top: 169-days.
The S&P 500 is 8.8% Below its 200-dMA & 2.8% Below its 50-dMA.
- Support points for the rally are around 3900, the early July highs (pretty much where we closed today) and the prior correction low of 3667. We should test the prior correction low.
SH, short the S&P 500 ETF.
SDS, 2x short S&P 500 ETF.
I have built these positions to significantly large values, although I am still not net short.
The following chart is a comparison of present VIX in 2022 (in White) and VIX in 2006-2008 (Blue). If the analog is good, the VIX will follow the blue line and result in a large drop in the S&P 500. The Financial crash of 2006-2008 was caused by a completely different set of circumstances. Chart wise, crashes do seem to follow a pattern so it is plausible that a crash might be coming. We must also remember that the past does not cause the present, so a crash from here is not guaranteed and certainly not by this one chart. On the other hand...
TODAY’S RANKING OF 15 ETFs (Ranked Daily)
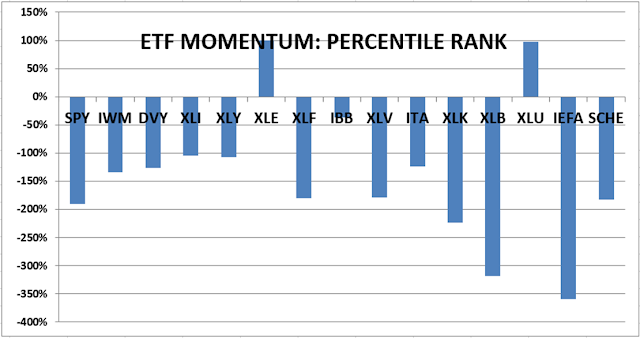
*For additional background on the ETF ranking system see NTSM Page at…
http://navigatethestockmarket.blogspot.com/p/exchange-traded-funds-etf-ranking.html

BEST DOW STOCKS - TODAY’S MOMENTUM RANKING OF THE DOW 30 STOCKS (Ranked Daily)
Here’s the revised DOW 30 and its momentum analysis. The top ranked stock receives 100%. The rest are then ranked based on their momentum relative to the leading stock.

For more details, see NTSM Page at…
https://navigatethestockmarket.blogspot.com/p/a-system-for-trading-dow-30-stocks-my_8.html

TUESDAY MARKET INTERNALS (NYSE DATA)
