“Trade what you see; not what you think.” – The Old Fool,
Richard McCranie, trader extraordinaire.
“When you want to help people, you tell them the truth.
When you want to help yourself, you tell them what they want to hear... The
fact that so many successful politicians are such shameless liars is not only a
reflection on them, it is also a reflection on us. When the people want the
impossible, only liars can satisfy.” ― Thomas
Sowell, senior fellow at the Hoover Institution.
MARKET REPORT / ANALYSIS
-Monday the S&P 500 rose about 0.2% to 4412.
-VIX rose about 2% to 15.07.
-The yield on the 10-year Treasury rose to 4.004%.
PULLBACK DATA:
-Drop from Top: 8.1%. 25.4% max (on a closing basis).
-Trading Days since Top: 379-days.
The S&P 500 is 9.8% ABOVE its 200-dMA and 3.6%
ABOVE its 50-dMA.
*I won’t call the correction over until the S&P 500
makes a new-high; however, evidence suggests the bottom was in the 3600 area
and we called a buy on 4 October 2022.
MY TRADING POSITIONS:
I am not trading as much as in the past. You may wish to
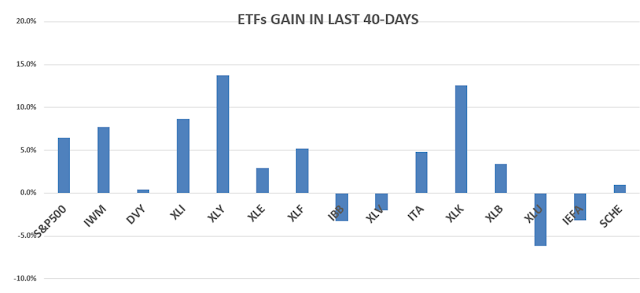
use the momentum charts and/or the Monday, 40-day gain charts for trading the
Dow stocks and ETFs.
MSFT – Microsoft.
XLK – Technology ETF.
XLY - Consumer Discretionary ETF.
KRE – Regional Banking ETF. This is a very small position
for me. KRE tested the May 4 low of 36.08 on much lower volume 11 &
12 May.
I haven’t sold yet. On the positive side, it has not
breached its recent low around 36.
SHY – Short term bonds. 30-day yield is 5.04% - 9 June
2023. (Trailing 1-year yield is 3.04%.) Once this weak period ends, I’ll sell
SHY and buy stocks/stock ETFs.
TODAY’S COMMENT:
The black curve in the above chart shows the S&P 500
since last July 2022. The Index has been in an uptrend since the October lows
and more recently, since mid-March. It bounced off its upper trendline on 15
June and again on 3 July. It is currently below its mid-June high when we said
it looked like the Index had made a short-term high. That call remains, but indicators, other than
the chart, are much more positive. Mr.
Market may ignore my indicator (It wouldn’t be unusual.) and the Index could
continue higher along its upper trend line. That’s a good reason for not
shorting the advance right now. I am still expecting the S&P 500 to retreat
to its lower trend line, sooner rather than later.
The red and green lines represent buying pressure minus
selling pressure so the upward trending lines are bullish. We can also see why this indicator was
instrumental in calling the October 2022 bottom.
The daily spread of 20 Indicators (Bulls minus Bears) remained
+1 (a positive number is bullish; negatives are bearish); the 10-day smoothed
sum that smooths the daily fluctuations improved from -14 to -5. (The
trend direction is more important than the actual number for the 10-day value.)
These numbers sometimes change after I post the blog based on data that comes
in late. Most of these 20 indicators are short-term so they tend to bounce
around a lot.
LONG-TERM INDICATOR: The Long Term NTSM indicator
remained HOLD: PRICE is positive; SENTIMENT, VIX & VOLUME are neutral.
(The important BUY in this indicator was on 21 October,
7-days after the bottom. For my NTSM overall signal, I suggested that a
short-term buying opportunity occurred on 27 September (based on improved
market internals on the retest), although without market follow-thru, I was
unwilling to call a buy; however, I did close shorts and increased stock
holdings. I issued a Buy-Signal on 4 October, 6-days before the final bottom,
based on stronger market action that confirmed the market internals signal. The
NTSM sell-signal was issued 20 December, 8 sessions before the high of this
recent bear market, based on the bearish “Friday Rundown” of indicators.)
Bottom line: I remain a cautious Bull, still expecting a
decline of around 4-5% on the S&P 500 to start soon.
ETF - MOMENTUM ANALYSIS:
TODAY’S RANKING OF 15 ETFs
(Ranked Daily)
ETF ranking follows:
The top ranked ETF receives
100%. The rest are then ranked based on their momentum relative to the
leading ETF.
*For additional background on
the ETF ranking system see NTSM Page at…
http://navigatethestockmarket.blogspot.com/p/exchange-traded-funds-etf-ranking.html
DOW STOCKS - TODAY’S MOMENTUM RANKING
OF THE DOW 30 STOCKS (Ranked Daily) DOW 30 momentum ranking
follows:
The top ranked Stock receives
100%. The rest are then ranked based on their momentum relative to the leading Stock.
For more details, see NTSM
Page at…
https://navigatethestockmarket.blogspot.com/p/a-system-for-trading-dow-30-stocks-my_8.html
MONDAY MARKET INTERNALS (NYSE
DATA)
My basket of Market Internals remained BUY. (My basket of Market
Internals is a decent trend-following analysis of current market action, but
should not be used alone for short term trading. They are most useful when they
diverge from the Index.)
...My current invested
position is about 55% stocks, including stock mutual funds and ETFs. I’m
usually about 50% invested in stocks.
I trade about 15-20% of the
total portfolio using the momentum-based analysis I provide here. If I can see
a definitive bottom, I’ll add a lot more stocks to the portfolio using an S&P
500 ETF.


 My basket of Market Internals remained BUY. (My basket of Market
Internals is a decent trend-following analysis of current market action, but
should not be used alone for short term trading. They are most useful when they
diverge from the Index.)
My basket of Market Internals remained BUY. (My basket of Market
Internals is a decent trend-following analysis of current market action, but
should not be used alone for short term trading. They are most useful when they
diverge from the Index.)