FED Beige Book ... GDP ... EIA Crude Inventories ... Momentum Trading DOW Stocks & ETFs … Stock Market Analysis ...
“Trade what you see; not what you think.” – The Old Fool,
Richard McCranie, trader extraordinaire.
“One of the inane things that’s taught in modern
university education is that a vast diversification is absolutely mandatory in
investing in common stocks ...That is an insane idea. It’s not that easy to
have a vast plethora of good opportunities that are easily identified. And if
you’ve only got three, I’d rather be in my best ideas instead of my worst.”
Charlie Munger, vice chairman of Berkshire Hathaway. Charles Munger passed
away, Tuesday at the age of 99.
“Gross Domestic Product (GDP). GDP is
simply the total amount of spending in an economy. GDP, as currently measured,
does not distinguish between “good” spending and “bad” spending. GDP does not
distinguish between consumption spending and investment spending. GDP also does
not distinguish whether spending is generated by existing wealth, by going into
debt temporarily, or by going into debt permanently. In this world, every dollar
spent on education or new means of production, is counted the same as every
dollar spent on epic bachelor parties and video games.” – Michael Lebowitz,
Real Investment Advice
GDP - 2ND ESTIMATE
/ FED BEIGE BOOK (Kiplinger)
“...the U.S. economy grew at a faster pace than
previously thought in the third quarter [ending in September]. Specifically, Q3
gross domestic product (GDP) came in at
5.2% vs the initial 4.9% estimate... The Fed's Beige Book was also released today, and it showed declines in
economic conditions in half of the central bank's 12 districts between October
6 and November 17. ‘Obviously a more somber report than the GDP numbers we saw
this morning," says Alex McGrath,
chief investment officer for NorthEnd Private Wealth. ‘Based on these readings,
it would appear that we have already entered a mild recession that
many have been predicting for a year," even as it runs counter to other
data we've seen.’” Story at...
https://www.kiplinger.com/investing/stocks/stock-market-today-stocks-give-back-gdp-gains-after-beige-book
EIA CRUDE INVENTORIES
U.S. commercial crude oil inventories (excluding those in
the Strategic Petroleum Reserve) increased by 1.6 million barrels from the
previous week. At 449.7 million barrels, U.S. crude oil inventories are
slightly above the five year average for this time of year.
https://ir.eia.gov/wpsr/wpsrsummary.pdf
MARKET REPORT / ANALYSIS
-Wednesday the S&P 500 slipped about 0.1% to 4551.
-VIX rose about 2% to 12.98.
-The yield on the 10-year Treasury slipped to 4.259%.
PULLBACK DATA:
-Drop from Top: 5.1%. 25.4% max (on a closing basis).
-Trading Days since All-Time Top: 479-days. (The top was
3 January 2022.)
The S&P 500 is 6.3% ABOVE its 200-dMA and 4.6% ABOVE
its 50-dMA.
*I won’t call the correction over until the S&P 500
makes a new-high; however, evidence suggests the major bear-market bottom (25%
decline) was in the 3600 area and we called a buy on 4 October 2022.
MY TRADING POSITIONS:
XLK – Technology ETF (holding since the October 2022
lows).
XLY - Consumer Discretionary ETF. (Holding since the
October 2022 lows - I bought more XLY Monday, 8/21.)
I took profits and then reestablished positions as
follows:
SPY – I bought a large position in the S&P 500
Friday, 8/14, in my 401k (it has limited choices).
XLE – Added Tuesday, 8/22.
SSO – 2x S&P 500 ETF. Added 8/24.
MSFT – added 11/16/2023.
TODAY’S COMMENT:
The daily spread of 20 Indicators (Bulls minus Bears) declined
from +5 to zero (a positive number is bullish; negatives are bearish); the
10-day smoothed sum that smooths the daily fluctuations declined from +57
to +47. (The trend direction is more important than the actual number for the
10-day value.) These numbers sometimes change after I post the blog based on
data that comes in late. Most of these 20 indicators are short-term so they
tend to bounce around a lot.
LONG-TERM INDICATOR: The Long Term NTSM indicator improved
to BUY: PRICE & VIX are bullish; VOLUME & SENTIMENT are neutral.
(The important major BUY in this indicator was on 21
October 2022, 7-days after the bear-market bottom. For my NTSM overall signal,
I suggested that a short-term buying opportunity occurred on 27 September
(based on improved market internals on the retest), although without market
follow-thru, I was unwilling to call a buy; however, I did close shorts and
increased stock holdings. I issued a Buy-Signal on 4 October, 6-days before the
final bottom, based on stronger market action that confirmed the market internals
signal. The NTSM sell-signal was issued 21 December, 9 sessions before the high
of this recent bear market, based on the bearish “Friday Rundown” of
indicators.)
BOTTOM LINE
I remain bullish.
ETF - MOMENTUM ANALYSIS:
TODAY’S RANKING OF 15 ETFs (Ranked Daily)
ETF ranking follows:
The top ranked ETF receives
100%. The rest are then ranked based on their momentum relative to the leading
ETF.
*For additional background on
the ETF ranking system see NTSM Page at…
http://navigatethestockmarket.blogspot.com/p/exchange-traded-funds-etf-ranking.html
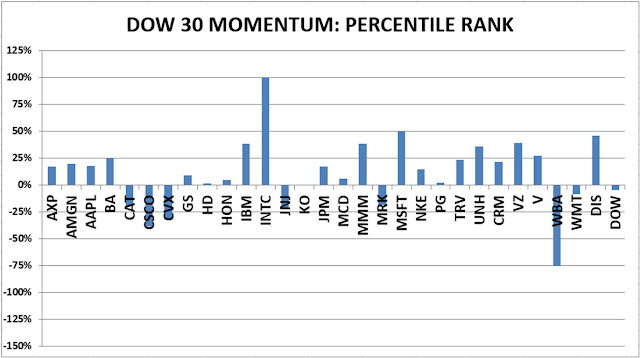
DOW STOCKS - TODAY’S MOMENTUM RANKING
OF THE DOW 30 STOCKS (Ranked Daily)
DOW 30 momentum ranking follows:
The top ranked Stock receives
100%. The rest are then ranked based on their momentum relative to the leading Stock.
For more details, see NTSM
Page at…
https://navigatethestockmarket.blogspot.com/p/a-system-for-trading-dow-30-stocks-my_8.html
WEDNESDAY MARKET INTERNALS
(NYSE DATA)
My basket of Market Internals remained HOLD. (My basket of Market
Internals is a decent trend-following analysis of current market action, but
should not be used alone for short term trading. They are most useful when they
diverge from the Index.)
...My current invested
position is about 75% stocks, including stock mutual funds and ETFs. I’m
usually about 50% invested in stocks. I’m “over invested” now expecting new,
all-time highs this year. That burns all the cash. I have about 25% of the portfolio in bonds.
I trade about 15-20% of the
total portfolio using the momentum-based analysis I provide here. When I see a
definitive bottom, I add a lot more stocks to the portfolio using an S&P
500 ETF as I did back in October.