S&P GLOBAL COMPOSITE PMI (S&P Global)
“US businesses signalled a further marginal expansion in output during November, with the rate of growth in business activity in line with that seen in October. Although manufacturers and service providers registered another monthly rise in activity, paces of expansion were only slight overall. Total new orders returned to growth, thereby ending a three-month sequence of contraction. That said, demand conditions at manufacturers were unchanged on the month.
https://www.pmi.spglobal.com/Public/Home/PressRelease/b72b9c19b3bd48e78027009aad143044
-Friday the S&P 500 rose about 0.1% to 4559.
-VIX dipped about 2% to 12.66.
-The yield on the 10-year Treasury rose to 4.476%.
-Drop from Top: 4.9%. 25.4% max (on a closing basis).
-Trading Days since All-Time Top: 476-days. (The top was 3 January 2022.)
The S&P 500 is 6.7% ABOVE its 200-dMA and 4.9% ABOVE its 50-dMA.
*I won’t call the correction over until the S&P 500 makes a new-high; however, evidence suggests the major bear-market bottom (25% decline) was in the 3600 area and we called a buy on 4 October 2022.
XLK – Technology ETF (holding since the October 2022 lows).
XLY - Consumer Discretionary ETF. (Holding since the October 2022 lows - I bought more XLY Monday, 8/21.)
SPY – I bought a large position in the S&P 500 Friday, 8/14, in my 401k (it has limited choices).
XLE – Added Tuesday, 8/22.
SSO – 2x S&P 500 ETF. Added 8/24.
MSFT – added 11/16/2023.
The NYSE closed at 1PM today. Trading was light.
-There was a Follow-thru Day 14 November. This cancels all Distribution Days.
-The smoothed advancing volume on the NYSE is rising.
-The 10-dMA percentage of issues advancing on the NYSE (Breadth) is above 50%.
-MACD of the percentage of issues advancing on the NYSE (breadth) made a bullish crossover 12 October.
-Smoothed Buying Pressure minus Selling Pressure.
-MACD of S&P 500 price made a bullish crossover 2 Nov.
-Long-term new-high/new-low data.
-Short-term new-high/new-low data.
-My Money Trend indicator is rising.
-Slope of the 40-dMA of New-highs is rising.
-McClellan Oscillator.
-The graph of the 100-day Count (the 100-day sum of up-days).
-The Smart Money (late-day action).
-On average, the size of up-moves has been larger than the size of down-moves over the last month.
-VIX indicator.
-There was a high up-volume day on 14 November. In addition, there were back-to-back, high up-volume days (80%+) on the NYSE 2 & 3 Nov.
-The 5-day EMA is above the 10-day EMA, so short-term momentum is bullish.
-The 5-10-20 Timer System is BUY.
-There was a Zweig Breadth Thrust 3 November. That’s a rare, very-bullish sign, that will remain bullish until the McClellan Oscillator turns negative.
-75% of the 15-ETFs that I track have been up over the last 10-days. (45-55% is neutral.)
-There have been 2 Statistically-Significant days (big moves in price-volume) in the last 15-days.
-Sentiment.
-Bollinger Band Squeeze 28 April - expired.
-Bollinger Bands.
-The 50-dMA percentage of issues advancing on the NYSE (Breadth) has not been below 50%, for more than 3 days in a row.
-Issues advancing on the NYSE (Breadth) compared to the S&P 500.
-9 November there was a Bearish Outside Reversal Day, but since the McClellan Oscillator is bullish, I’ll call this one neutral.
-There was a New-high/New-low spread reversal on 4 October (based on std deviation of spread). - Expired
-The S&P 500 is 6.7% above its 200-dMA. (Bear indicator is 12% above the 200-day.)
-The short-term, 10-day EMA, Fosback Hi-Low Logic Index.
-The long-term, 50-dEMA, Fosback Hi-Low Logic Index.
-There were Hindenburg Omen signals 11 & 12 Sept 2023 – expired. The McClellan Oscillator turned positive.
-There have been 8 up-days over the last 10 sessions.
-The Calm-before-the-Storm/Panic Indicator flashed a top warning signal 15 Sept., but it may well have been a bottom signal. - Expired
-2.8% of all issues traded on the NYSE made new, 52-week highs when the S&P 500 made a new all-time-high, 3 January 2022. (There is no bullish signal for this indicator.) This indicated that the advance was too narrow and a correction was likely to be >10%. It proved correct, but is now Expired.
-Overbought/Oversold Index (Advance/Decline Ratio).
-The 50-dMA percentage of issues advancing on the NYSE (Breadth) is below 50%
-The 100-dMA percentage of issues advancing on the NYSE (Breadth) is below 50%
-RSI.
-There have been 16 up-days over the last 20 sessions – overbought.
-Smart Money is bullish, but overbought
-S&P 500 spread vs. Utilities (XLU-ETF).
-XLI-ETF (Cyclical Industrials) vs the S&P 500.

I remain bullish.
TODAY’S RANKING OF 15 ETFs (Ranked Daily)
ETF ranking follows:
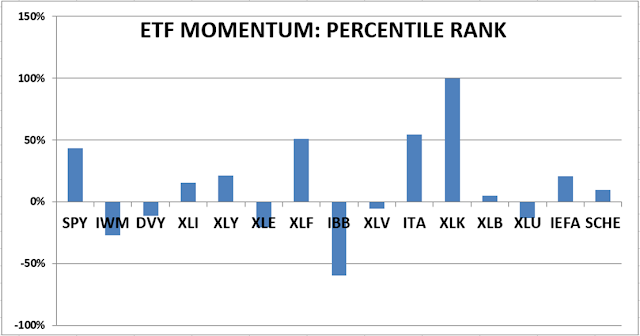
The top ranked ETF receives 100%. The rest are then ranked based on their momentum relative to the leading ETF.
*For additional background on the ETF ranking system see NTSM Page at…
http://navigatethestockmarket.blogspot.com/p/exchange-traded-funds-etf-ranking.html
DOW 30 momentum ranking follows:

For more details, see NTSM Page at…
https://navigatethestockmarket.blogspot.com/p/a-system-for-trading-dow-30-stocks-my_8.html
