Wednesday, December 4, 2024

ADP Employment ... ISM Non-Manufacturing ... Factory Orders ... Momentum Trading DOW Stocks & ETFs … Stock Market Analysis

SHORT BLOG TODAY (AS OF 1PM) – I AM TOO BUSY.
 
“Trade what you see; not what you think.” – The Old Fool, Richard McCranie, trader extraordinaire.
 
“Far more money has been lost by investors in preparing for corrections, or anticipating corrections, than has been lost in the corrections themselves.” - Peter Lynch, former manager of Fidelity’s Magellan® fund.
 
“With seven weeks to go before he turns the keys to the U.S. government over to President-elect Donald Trump, President Joe Biden has made history in a way only Washington’s “swamp” could celebrate. For the first time ever, the Federal Register, which publishes all the government regulations and administration’s proposals, smashed through the record held by former President Barack Obama to set a new level that is sure to grow higher as the Biden team moves to lock in its liberal agenda.” Story at...
Biden did it: Most regulation-filled Federal Register ever at 96,088 pages
 
THE PARDON (LA Times)
“It came as a surprise that President Biden unconditionally pardoned his son Hunter, a convicted felon, after repeatedly vowing that he would not. For the past few months, each time Biden or his press secretary was asked whether a pardon was in the cards, they both emphatically said no. So much for one of the president’s favorite lines, “I give you my word as a Biden.”... How can any of us be outraged at the way Trump and those in his circle seem immune from the consequences of their malign actions if we applaud Biden’s pardon of his son for crimes he has either been convicted of or pleaded guilty to?” Commentary at...
Column: President Biden's pardon of his son Hunter is understandable. It's also unforgivable
 
ADP EMPLOYMENT (ADP via prnewswire)
“Private sector employment increased by 146,000 jobs in November and annual pay was up 4.8 percent year-over-year, according to the November ADP® National Employment ReportTM produced by ADP Research in collaboration with the Stanford Digital Economy Lab ("Stanford Lab")... "While overall growth for the month was healthy, industry performance was mixed," said Nela Richardson, chief economist, ADP. "Manufacturing was the weakest we've seen since spring. Financial services and leisure and hospitality were also soft." Press release at...
https://www.prnewswire.com/news-releases/adp-national-employment-report-private-sector-employment-increased-by-146-000-jobs-in-november-annual-pay-was-up-4-8-302322430.html#
 
ISM NON MANUFACTURING (ISM via prnewswire)
“Economic activity in the services sector expanded for the fifth consecutive month in November, say the nation's purchasing and supply executives in the latest Services ISM® Report On Business®. The Services PMI® registered 52.1 percent, indicating expansion for the 51st time in 54 months since recovery from the coronavirus pandemic-induced recession began in June 2020...  the services sector has returned to sustained growth. Generally, respondents' comments were neutral to positive...” Press release at...
https://www.prnewswire.com/news-releases/services-pmi-at-52-1-november-2024-services-ism-report-on-business-302321303.html
 
FACTORY ORDERS (Yahoo Finance)
“New orders for U.S.-manufactured goods rebounded marginally in October while business spending on equipment appeared to have softened early in the fourth quarter. Factory orders increased 0.2%...” Story at...
https://finance.yahoo.com/news/us-factory-orders-rise-marginally-152426530.html
 
MARKET REPORT / ANALYSIS – As of 1PM Wednesday
-Wednesday the S&P 500 is up about 0.4% to 6073 at mid-day.
-VIX rose about 0.1% to 13.31.
-The yield on the 10-year Treasury declined (compared to about this time, prior trading day) to 4.188%.
 
MY TRADING POSITIONS:
XLK – Holding since the October 2022 lows.  Added more 9/20.
SSO – added 10/16.
SPY – added 9/19 & more 10/16
QLD – added 11/5.
UWM – added 11/11
 
CURRENT SUMMARY OF APPROXIMATELY 50 INDICATORS – AS OF 1PM WEDNESDAY:
Today, (as of 1 PM) of the 50-Indicators I track, 9 gave Bear-signs and 14 were Bullish. The rest are neutral. (It is normal to have a lot of neutral indicators since many of the indicators are top or bottom indicators that will signal only at extremes.)

The daily Bull/Bear, 50-Indicator spread (Bull Indicators minus Bear Indicators, red curve in the chart above) declined to +5 (5 more Bull indicators than Bear indicators – yesterday’s numbers changed due to late data).
 
TODAY’S COMMENT
Today’s Bull-Bear spread of +5, is a mildly bullish to Neutral sign. The 10-dMA of the 50-Indicator Spread (purple line in the chart above) is moving higher today so that is still bullish. The overall 50-Indicator spread signal is Bullish. (I follow the 10-dMA for trading buy-signals and as an indicator for sell signals.)
 
We’re seeing a swing to the bearish side in the indicators.  They aren’t there now, but they are drifting down. That is due in part to the bullish moves we’ve seen recently. My simplest indicator tracks the number of up or down days over 2 and 4 week trading periods. As of 1Pm Wednesday, there have been 16 up-days in the last 20 days and 9 days up on the last 10.  Both are overly bullish and they are bearish indicator signals.
 
The S&P 500 is at a new all-time high again Wednesday (as of 1PM) but only 3.5% of issues on the NYSE made new, 52-week highs today. That demonstrates a significant narrowing of breadth. We’ll just have to see what the closing numbers look like. It doesn’t feel like there is significant trouble ahead, but I’ll be following the indicators rather than guessing.
 
There is only 1 top-indicator warning of a top – breadth is too far ahead of the S&P 500.  This indicator can be early, so no point in worrying about it yet.
 
If Bollinger Bands, RSI or other top indicators start acting up I may be forced to take profits in leveraged positions (SSO, QLD, & UWM), especially if the S&P 500 is at its upper trend line.
 
For now, I won’t be making any changes in the portfolio. A few down days would be good for the markets.
 
BOTTOM LINE
I’m cautiously bullish.
 
WEDNESDAY MARKET INTERNALS (NYSE DATA)
My basket of Market Internals remained HOLD.
(My basket of Market Internals is a decent trend-following analysis that is most useful when it diverges from the Index.) 


...My current invested position is about 70% stocks, including stock mutual funds and ETFs. I’m usually about 50% invested in stocks when markets are stretched. (75% is my max stock allocation when I am confident that markets will continue higher.)
 
I trade about 15-20% of the total portfolio using the momentum-based analysis I provide here. When I see bullish signs, I add a lot more stocks to the portfolio, usually by using an S&P 500 ETF as I did back in October 2022 and 2023.
 

Tuesday, December 3, 2024

... Momentum Trading DOW Stocks & ETFs … Stock Market Analysis

 
“Trade what you see; not what you think.” – The Old Fool, Richard McCranie, trader extraordinaire.
 
“Far more money has been lost by investors in preparing for corrections, or anticipating corrections, than has been lost in the corrections themselves.” - Peter Lynch, former manager of Fidelity’s Magellan® fund.
 
MARKET REPORT / ANALYSIS
-Tuesday the S&P 500 rose about 0.1% to 6050.
-VIX declined about 0.3% to 13.30.
-The yield on the 10-year Treasury rose (compared to about this time, prior trading day) to 4.226%.
 
MY TRADING POSITIONS:
XLK – Holding since the October 2022 lows.  Added more 9/20.
SSO – added 10/16.
SPY – added 9/19 & more 10/16
QLD – added 11/5.
UWM – added 11/11
 
CURRENT SUMMARY OF APPROXIMATELY 50 INDICATORS:
Today, of the 50-Indicators I track, 8 gave Bear-signs and 16 were Bullish. The rest are neutral. (It is normal to have a lot of neutral indicators since many of the indicators are top or bottom indicators that will signal only at extremes.)

The daily Bull/Bear, 50-Indicator spread (Bull Indicators minus Bear Indicators, red curve in the chart above) remained to +8 (8 more Bull indicators than Bear indicators – yesterday’s numbers changed due to late data).
 
TODAY’S COMMENT
Not much different than yesterday:
Today’s Bull-Bear spread of +8, is still a bullish sign, especially since the 10-dMA of the 50-Indicator Spread (purple line in the chart above) is moving higher today. The overall 50-Indicator spread signal is Bullish. (I follow the 10-dMA for trading buy-signals and as an indicator for sell signals.)
 
The S&P 500 made a new all-time high Tuesday as it did Monday.  4.5% of issues on the NYSE made new, 52-week highs today. That demonstrates a decent advance. It’s another confirmation that markets look good and can continue higher. If a pullback were to occur now on the S&P 500 (and ‘m not predicting one) it is likely that it would be in the range of 3-5%. That would be a normal pullback to around the 50-dMA. There was a new Bear sign today...
 
8 of the last 10 trading days have been up-days.  That should bring us a down day tomorrow, but by itself, it does not suggest a pullback.
 
BOTTOM LINE
I’m bullish.
 
ETF - MOMENTUM ANALYSIS:
TODAY’S RANKING OF 15 ETFs (Ranked Daily) ETF ranking follows:
 

The top ranked ETF receives 100%. The rest are then ranked based on their momentum relative to the leading ETF.
*For additional background on the ETF ranking system see NTSM Page at…
http://navigatethestockmarket.blogspot.com/p/exchange-traded-funds-etf-ranking.html
 
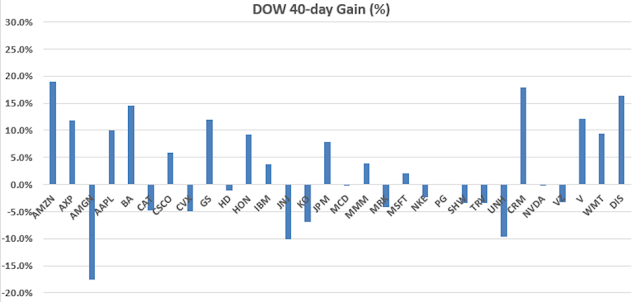
DOW STOCKS - TODAY’S MOMENTUM RANKING OF THE DOW 30 STOCKS (Ranked Daily)
 

The top ranked Stock receives 100%. The rest are then ranked based on their momentum relative to the leading Stock.
For more details, see NTSM Page at…
https://navigatethestockmarket.blogspot.com/p/a-system-for-trading-dow-30-stocks-my_8.html
 
TUESDAY MARKET INTERNALS (NYSE DATA)

My basket of Market Internals remained HOLD.
(My basket of Market Internals is a decent trend-following analysis that is most useful when it diverges from the Index.) 


...My current invested position is about 70% stocks, including stock mutual funds and ETFs. I’m usually about 50% invested in stocks when markets are stretched. (75% is my max stock allocation when I am confident that markets will continue higher.)
 
I trade about 15-20% of the total portfolio using the momentum-based analysis I provide here. When I see bullish signs, I add a lot more stocks to the portfolio, usually by using an S&P 500 ETF as I did back in October 2022 and 2023.
 

Monday, December 2, 2024

ISM Manufacturing ... Momentum Trading DOW Stocks & ETFs … Stock Market Analysis

 
“Trade what you see; not what you think.” – The Old Fool, Richard McCranie, trader extraordinaire.
 
“Far more money has been lost by investors in preparing for corrections, or anticipating corrections, than has been lost in the corrections themselves.” - Peter Lynch, former manager of Fidelity’s Magellan® fund.
 
ISM MANUFACTURING (ISM)
“Economic activity in the manufacturing sector contracted in November for the eighth consecutive month and the 24th time in the last 25 months, say the nation's supply executives in the latest Manufacturing ISM® Report On Business®... “U.S. manufacturing activity contracted again in November, but at a slower rate compared to last month. Demand continues to be weak but may be moderating, output declined again, and inputs stayed accommodative.” Press release at... 
https://www.ismworld.org/supply-management-news-and-reports/reports/ism-report-on-business/pmi/november/
 
MARKET REPORT / ANALYSIS
-Monday the S&P 500 rose about 0.2% to 6047.
-VIX declined about 1% to 13.33.
-The yield on the 10-year Treasury rose (compared to about this time, prior trading day) to 4.196%.
 
MY TRADING POSITIONS:
XLK – Holding since the October 2022 lows.  Added more 9/20.
SSO – added 10/16.
SPY – added 9/19 & more 10/16
QLD – added 11/5.
UWM – added 11/11
 
CURRENT SUMMARY OF APPROXIMATELY 50 INDICATORS:
Today, of the 50-Indicators I track, 7 gave Bear-signs and 16 were Bullish. The rest are neutral. (It is normal to have a lot of neutral indicators since many of the indicators are top or bottom indicators that will signal only at extremes.)

The daily Bull/Bear, 50-Indicator spread (Bull Indicators minus Bear Indicators, red curve in the chart above) declined to +9 (9 more Bull indicators than Bear indicators).
 
TODAY’S COMMENT
Today’s Bull-Bear spread of +9 is still a bullish sign, especially since the 10-dMA of the 50-Indicator Spread (purple line in the chart above) is moving higher today. The overall 50-Indicator spread signal is Bullish. (I follow the 10-dMA for trading buy-signals and as an indicator for sell signals.)
 
The S&P 500 made a new all-time high Monday.  About 5% of issues on the NYSE made new, 52-week highs today. That demonstrates a decent advance. It’s another confirmation that markets look good and can continue higher. If a pullback were to occur now on the S&P 500 (and ‘m not predicting one) it is likely that it would be in the range of 3-5%. That would be a normal pullback to around the 50-dMA.
 
BOTTOM LINE
I’m bullish.
 
ETF - MOMENTUM ANALYSIS:
TODAY’S RANKING OF 15 ETFs (Ranked Daily) ETF ranking follows:
 

The top ranked ETF receives 100%. The rest are then ranked based on their momentum relative to the leading ETF.
*For additional background on the ETF ranking system see NTSM Page at…
http://navigatethestockmarket.blogspot.com/p/exchange-traded-funds-etf-ranking.html

DOW STOCKS - TODAY’S MOMENTUM RANKING OF THE DOW 30 STOCKS (Ranked Daily)
 

The top ranked Stock receives 100%. The rest are then ranked based on their momentum relative to the leading Stock.
For more details, see NTSM Page at…
https://navigatethestockmarket.blogspot.com/p/a-system-for-trading-dow-30-stocks-my_8.html

MONDAY MARKET INTERNALS (NYSE DATA)
My basket of Market Internals declined to HOLD.
(My basket of Market Internals is a decent trend-following analysis that is most useful when it diverges from the Index.) 


...My current invested position is about 70% stocks, including stock mutual funds and ETFs. I’m usually about 50% invested in stocks when markets are stretched. (75% is my max stock allocation when I am confident that markets will continue higher.)
 
I trade about 15-20% of the total portfolio using the momentum-based analysis I provide here. When I see bullish signs, I add a lot more stocks to the portfolio, usually by using an S&P 500 ETF as I did back in October 2022 and 2023.