“Trade what you see; not what you think.” – The Old Fool, Richard McCranie, trader extraordinaire.
“Economic activity in the manufacturing sector contracted in November for the eighth consecutive month and the 24th time in the last 25 months, say the nation's supply executives in the latest Manufacturing ISM® Report On Business®... “U.S. manufacturing activity contracted again in November, but at a slower rate compared to last month. Demand continues to be weak but may be moderating, output declined again, and inputs stayed accommodative.” Press release at...
https://www.ismworld.org/supply-management-news-and-reports/reports/ism-report-on-business/pmi/november/
-Monday the S&P 500 rose about 0.2% to 6047.
-VIX declined about 1% to 13.33.
-The yield on the 10-year Treasury rose (compared to about this time, prior trading day) to 4.196%.
XLK – Holding since the October 2022 lows. Added more 9/20.
SSO – added 10/16.
SPY – added 9/19 & more 10/16
QLD – added 11/5.
UWM – added 11/11
Today, of the 50-Indicators I track, 7 gave Bear-signs and 16 were Bullish. The rest are neutral. (It is normal to have a lot of neutral indicators since many of the indicators are top or bottom indicators that will signal only at extremes.)
The daily Bull/Bear, 50-Indicator spread (Bull Indicators minus Bear Indicators, red curve in the chart above) declined to +9 (9 more Bull indicators than Bear indicators).
Today’s Bull-Bear spread of +9 is still a bullish sign, especially since the 10-dMA of the 50-Indicator Spread (purple line in the chart above) is moving higher today. The overall 50-Indicator spread signal is Bullish. (I follow the 10-dMA for trading buy-signals and as an indicator for sell signals.)
I’m bullish.
TODAY’S RANKING OF 15 ETFs (Ranked Daily) ETF ranking follows:
*For additional background on the ETF ranking system see NTSM Page at…
http://navigatethestockmarket.blogspot.com/p/exchange-traded-funds-etf-ranking.html
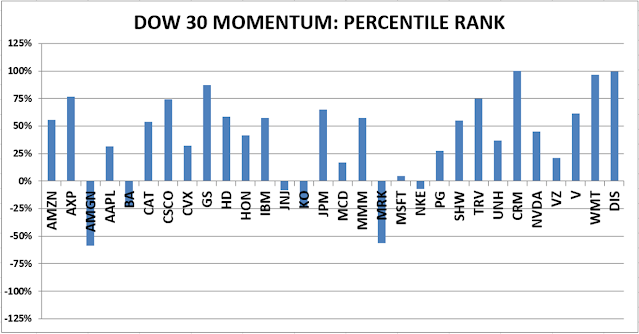
DOW STOCKS - TODAY’S MOMENTUM RANKING OF THE DOW 30 STOCKS (Ranked Daily)
For more details, see NTSM Page at…
https://navigatethestockmarket.blogspot.com/p/a-system-for-trading-dow-30-stocks-my_8.html
MONDAY MARKET INTERNALS (NYSE DATA)
My basket of Market Internals declined to HOLD. (My basket of Market Internals is a decent trend-following analysis that is most useful when it diverges from the Index.)


